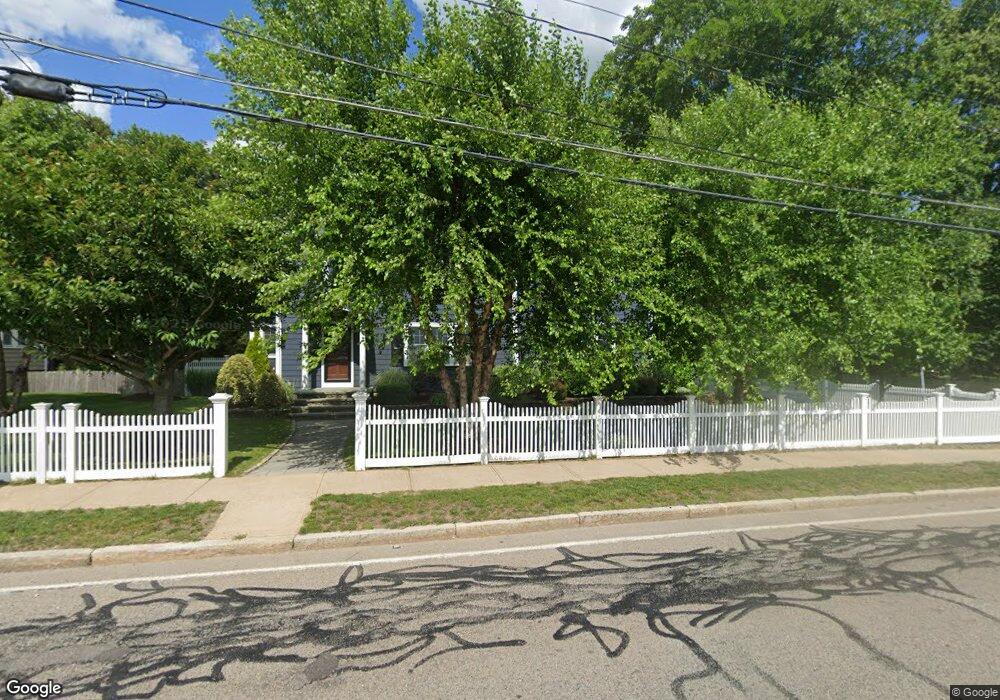
284 Common St Walpole, MA 02081
Estimated Value: $907,000 - $1,069,000
4
Beds
3
Baths
3,130
Sq Ft
$317/Sq Ft
Est. Value
About This Home
This home is located at 284 Common St, Walpole, MA 02081 and is currently estimated at $992,296, approximately $317 per square foot. 284 Common St is a home located in Norfolk County with nearby schools including Boyden School, Eleanor N. Johnson Middle School, and Walpole High School.
Ownership History
Date
Name
Owned For
Owner Type
Purchase Details
Closed on
Aug 29, 1989
Sold by
Brigham Agnes M
Bought by
Niden Adam P
Current Estimated Value
Home Financials for this Owner
Home Financials are based on the most recent Mortgage that was taken out on this home.
Original Mortgage
$142,600
Interest Rate
9.67%
Mortgage Type
Purchase Money Mortgage
Create a Home Valuation Report for This Property
The Home Valuation Report is an in-depth analysis detailing your home's value as well as a comparison with similar homes in the area
Home Values in the Area
Average Home Value in this Area
Purchase History
| Date | Buyer | Sale Price | Title Company |
|---|---|---|---|
| Niden Adam P | $178,250 | -- |
Source: Public Records
Mortgage History
| Date | Status | Borrower | Loan Amount |
|---|---|---|---|
| Open | Niden Adam P | $210,750 | |
| Closed | Niden Adam P | $141,000 | |
| Closed | Niden Adam P | $142,600 |
Source: Public Records
Tax History
| Year | Tax Paid | Tax Assessment Tax Assessment Total Assessment is a certain percentage of the fair market value that is determined by local assessors to be the total taxable value of land and additions on the property. | Land | Improvement |
|---|---|---|---|---|
| 2025 | $11,759 | $916,500 | $333,800 | $582,700 |
| 2024 | $11,343 | $858,000 | $320,900 | $537,100 |
| 2023 | $10,780 | $776,100 | $279,100 | $497,000 |
| 2022 | $10,016 | $692,700 | $258,400 | $434,300 |
| 2021 | $9,532 | $642,300 | $243,800 | $398,500 |
| 2020 | $9,136 | $609,500 | $230,000 | $379,500 |
| 2019 | $8,794 | $582,400 | $221,200 | $361,200 |
| 2018 | $8,792 | $575,800 | $213,100 | $362,700 |
| 2017 | $8,499 | $554,400 | $204,800 | $349,600 |
| 2016 | $7,970 | $512,200 | $196,900 | $315,300 |
| 2015 | $7,671 | $488,600 | $187,400 | $301,200 |
| 2014 | $7,327 | $464,900 | $187,400 | $277,500 |
Source: Public Records
Map
Nearby Homes
- 145 South St Unit 18
- 11 Clark Ave
- 50 Riverside Place
- 37 Alice Ave
- 510 Common St
- 106 Lewis Ave
- 222 School St Unit 9
- 6 Eleanor Rd
- 65-67 Diamond St
- 23 Rainbow Pond Dr Unit D1
- 32 Rainbow Pond Dr Unit B1
- 28 Eastover Rd Unit 28
- 9 Rainbow Pond Dr Unit 6
- 700 East St Unit L
- 6 Litchfields Way
- 1391 Main St Unit 305
- 1391 Main St Unit 301
- 26 Drake Cir
- 2 Kendall St
- 635 Old Post Rd Unit 303
Your Personal Tour Guide
Ask me questions while you tour the home.