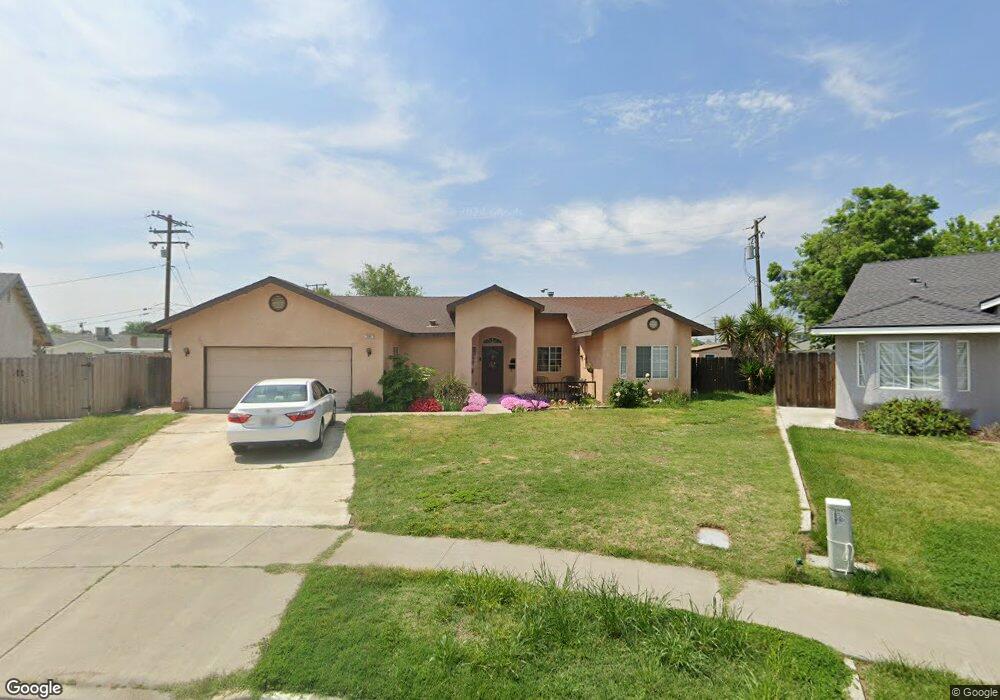
284 E Lemmon Way Hanford, CA 93230
Estimated Value: $315,000 - $334,000
3
Beds
2
Baths
1,328
Sq Ft
$246/Sq Ft
Est. Value
About This Home
This home is located at 284 E Lemmon Way, Hanford, CA 93230 and is currently estimated at $326,991, approximately $246 per square foot. 284 E Lemmon Way is a home located in Kings County with nearby schools including George Washington Elementary School, John F. Kennedy Junior High School, and Hanford High School.
Ownership History
Date
Name
Owned For
Owner Type
Purchase Details
Closed on
Jun 24, 2025
Sold by
Roberg Gloria Ann
Bought by
Gloria Ann Roberg Revocable Living Trust and Roberg
Current Estimated Value
Purchase Details
Closed on
Feb 25, 2000
Sold by
Hud
Bought by
Roberg William L and Roberg Gloria Ann
Purchase Details
Closed on
Mar 25, 1999
Sold by
Rodriguez Lorena
Bought by
Source One Mtg Services Corp
Purchase Details
Closed on
Jan 27, 1997
Sold by
Sanchez Fabian
Bought by
Rodriguez Lorena
Home Financials for this Owner
Home Financials are based on the most recent Mortgage that was taken out on this home.
Original Mortgage
$103,528
Interest Rate
7.62%
Mortgage Type
FHA
Purchase Details
Closed on
Jan 24, 1997
Sold by
Excel Construction & Development Inc
Bought by
Rodriguez Lorena
Home Financials for this Owner
Home Financials are based on the most recent Mortgage that was taken out on this home.
Original Mortgage
$103,528
Interest Rate
7.62%
Mortgage Type
FHA
Create a Home Valuation Report for This Property
The Home Valuation Report is an in-depth analysis detailing your home's value as well as a comparison with similar homes in the area
Home Values in the Area
Average Home Value in this Area
Purchase History
| Date | Buyer | Sale Price | Title Company |
|---|---|---|---|
| Gloria Ann Roberg Revocable Living Trust | -- | None Listed On Document | |
| Roberg William L | $85,000 | North American Title Co | |
| Source One Mtg Services Corp | $112,205 | First American Title Co | |
| Hud | -- | First American Title Co | |
| Rodriguez Lorena | -- | Hanford Title Co | |
| Rodriguez Lorena | $105,500 | Hanford Title Co |
Source: Public Records
Mortgage History
| Date | Status | Borrower | Loan Amount |
|---|---|---|---|
| Previous Owner | Rodriguez Lorena | $103,528 |
Source: Public Records
Tax History
| Year | Tax Paid | Tax Assessment Tax Assessment Total Assessment is a certain percentage of the fair market value that is determined by local assessors to be the total taxable value of land and additions on the property. | Land | Improvement |
|---|---|---|---|---|
| 2025 | $1,401 | $139,110 | $46,111 | $92,999 |
| 2023 | $1,401 | $133,710 | $44,321 | $89,389 |
| 2022 | $1,368 | $131,089 | $43,452 | $87,637 |
| 2021 | $1,337 | $128,519 | $42,600 | $85,919 |
| 2020 | $1,284 | $121,263 | $42,163 | $79,100 |
| 2019 | $1,261 | $118,885 | $41,336 | $77,549 |
| 2018 | $1,223 | $116,553 | $40,525 | $76,028 |
| 2017 | $1,203 | $114,267 | $39,730 | $74,537 |
| 2016 | $1,186 | $112,026 | $38,951 | $73,075 |
| 2015 | $1,177 | $110,343 | $38,366 | $71,977 |
| 2014 | $1,153 | $108,181 | $37,614 | $70,567 |
Source: Public Records
Map
Nearby Homes
- 2210 N Douty St
- 2204 Fairmont Dr
- 2335 N Douty St
- 2002 N Woodridge Way
- 120 W Magnolia Ave
- 2189 N Burl Dr
- 165 W Magnolia Ave
- 180 W Magnolia Ave
- 2055 N Burl Dr
- 100 W Terrace Dr
- 450 E Birch Ave
- 129 W Terrace Dr
- 2083 Parker Place
- 230 W Ash Ave
- 2352 Cabrillo Way
- 2504 N Kensington Way
- 496 W Earl Way
- 2557 Chestnut St
- 2134 Oakwood Ct
- 841 Moffat Dr
- 294 E Lemmon Way
- 295 E Lemmon Way
- 304 E Lemmon Way
- 305 E Lemmon Way
- 279 E Cortner St
- 2145 N Woodridge Way
- 292 E Richardson Way
- 302 E Richardson Way
- 315 E Lemmon Way
- 314 E Lemmon Way
- 285 E Cortner St
- 281 E Cortner St
- 2144 N Woodridge Way
- 2137 N Woodridge Way
- 295 E Cortner St
- 314 E Richardson Way
- 282 E Richardson Way
- 324 E Lemmon Way
- 325 E Lemmon Way
- 307 E Cortner St
Your Personal Tour Guide
Ask me questions while you tour the home.