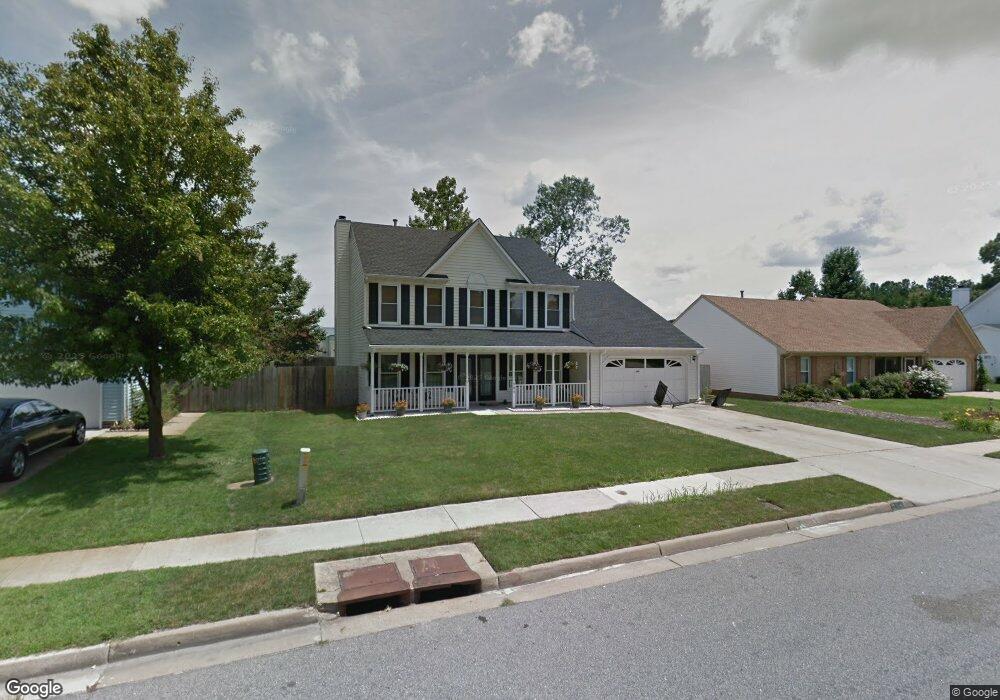
284 Golden Maple Dr Virginia Beach, VA 23452
Bow Creek NeighborhoodEstimated Value: $487,750 - $511,000
4
Beds
3
Baths
2,340
Sq Ft
$213/Sq Ft
Est. Value
About This Home
This home is located at 284 Golden Maple Dr, Virginia Beach, VA 23452 and is currently estimated at $499,438, approximately $213 per square foot. 284 Golden Maple Dr is a home located in Virginia Beach City with nearby schools including Lynnhaven Elementary School, Plaza Middle School, and Green Run High School.
Ownership History
Date
Name
Owned For
Owner Type
Purchase Details
Closed on
Dec 11, 2019
Sold by
Manojlovic Radmilo and Manojlovic Tatjana
Bought by
Muller Matthew A
Current Estimated Value
Home Financials for this Owner
Home Financials are based on the most recent Mortgage that was taken out on this home.
Original Mortgage
$324,022
Outstanding Balance
$285,108
Interest Rate
3.5%
Mortgage Type
FHA
Estimated Equity
$214,330
Purchase Details
Closed on
Aug 1, 2003
Sold by
Sauer Patrick
Bought by
Manojlovic Radmilo
Home Financials for this Owner
Home Financials are based on the most recent Mortgage that was taken out on this home.
Original Mortgage
$201,900
Interest Rate
5.28%
Mortgage Type
FHA
Purchase Details
Closed on
Aug 21, 2001
Sold by
Mai Long Viet
Bought by
Sauer Patrick J
Home Financials for this Owner
Home Financials are based on the most recent Mortgage that was taken out on this home.
Original Mortgage
$139,040
Interest Rate
7.21%
Create a Home Valuation Report for This Property
The Home Valuation Report is an in-depth analysis detailing your home's value as well as a comparison with similar homes in the area
Home Values in the Area
Average Home Value in this Area
Purchase History
| Date | Buyer | Sale Price | Title Company |
|---|---|---|---|
| Muller Matthew A | $330,000 | Attorney | |
| Manojlovic Radmilo | $205,000 | -- | |
| Sauer Patrick J | $174,000 | -- |
Source: Public Records
Mortgage History
| Date | Status | Borrower | Loan Amount |
|---|---|---|---|
| Open | Muller Matthew A | $324,022 | |
| Previous Owner | Manojlovic Radmilo | $201,900 | |
| Previous Owner | Sauer Patrick J | $139,040 |
Source: Public Records
Tax History Compared to Growth
Tax History
| Year | Tax Paid | Tax Assessment Tax Assessment Total Assessment is a certain percentage of the fair market value that is determined by local assessors to be the total taxable value of land and additions on the property. | Land | Improvement |
|---|---|---|---|---|
| 2025 | $4,065 | $427,600 | $140,000 | $287,600 |
| 2024 | $4,065 | $419,100 | $140,000 | $279,100 |
| 2023 | $3,922 | $396,200 | $130,000 | $266,200 |
| 2022 | $3,784 | $382,200 | $129,000 | $253,200 |
| 2021 | $3,390 | $342,400 | $100,000 | $242,400 |
| 2020 | $3,208 | $315,300 | $98,000 | $217,300 |
| 2019 | $3,075 | $296,400 | $98,000 | $198,400 |
| 2018 | $2,971 | $296,400 | $98,000 | $198,400 |
| 2017 | $2,894 | $288,700 | $98,000 | $190,700 |
| 2016 | $2,807 | $283,500 | $98,000 | $185,500 |
| 2015 | $2,747 | $277,500 | $98,000 | $179,500 |
| 2014 | $2,432 | $279,800 | $102,900 | $176,900 |
Source: Public Records
Map
Nearby Homes
- 356 Golden Maple Dr
- 224 Hospital Dr
- 304 Vine Ct
- 220 Tobin Arch
- 315 Rutherglen Muse
- 694 Rivers Reach
- 401 Turnbridge Close
- 635 Rivers Reach
- 662 Rivers Reach
- 502 Pheasant Run
- 413 Cameron Ln
- 209 Gimbert Dr
- 325 Appian Ave
- 301 Bethune Dr
- 254 Gimbert Dr
- 3284 Skipper Dr
- 2933 Pinewood Dr
- 200 Victoria Dr
- 1302 Sebastain Ct
- 1329 Sebastian Ct
- 280 Golden Maple Dr
- 288 Golden Maple Dr
- 285 Golden Maple Dr
- 276 Golden Maple Dr
- 281 Golden Maple Dr
- 292 Golden Maple Dr
- 293 Golden Maple Dr
- 277 Golden Maple Dr
- 272 Golden Maple Dr
- 3085 Silver Maple Dr
- 3089 Silver Maple Dr
- 3081 Silver Maple Dr
- 273 Golden Maple Dr
- 296 Golden Maple Dr
- 3077 Silver Maple Dr
- 300 Golden Maple Dr
- 3093 Silver Maple Dr
- 268 Golden Maple Dr
- 269 Golden Maple Dr
- 3073 Silver Maple Dr