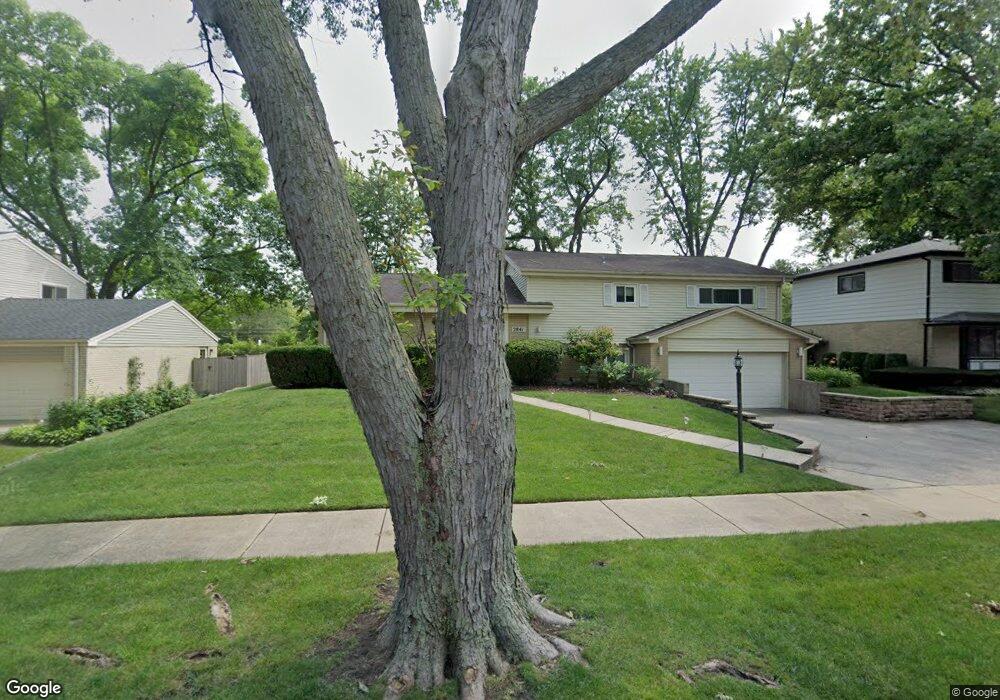
2841 Aspen Rd Northbrook, IL 60062
Estimated Value: $686,000 - $759,000
4
Beds
3
Baths
1,848
Sq Ft
$390/Sq Ft
Est. Value
About This Home
This home is located at 2841 Aspen Rd, Northbrook, IL 60062 and is currently estimated at $720,975, approximately $390 per square foot. 2841 Aspen Rd is a home located in Cook County with nearby schools including Hickory Point Elementary School, Shabonee Elementary School, and Wood Oaks Jr High School.
Ownership History
Date
Name
Owned For
Owner Type
Purchase Details
Closed on
Oct 1, 1998
Sold by
Kang Hang Woon and Kang Chung Cha
Bought by
Scholl Ada J and Scholl Ellen I
Current Estimated Value
Home Financials for this Owner
Home Financials are based on the most recent Mortgage that was taken out on this home.
Original Mortgage
$227,150
Outstanding Balance
$49,646
Interest Rate
6.88%
Estimated Equity
$671,329
Purchase Details
Closed on
Dec 20, 1995
Sold by
Floyd C Thomas
Bought by
Kang Hang Woon and Kang Chung Cha
Home Financials for this Owner
Home Financials are based on the most recent Mortgage that was taken out on this home.
Original Mortgage
$170,000
Interest Rate
7.43%
Create a Home Valuation Report for This Property
The Home Valuation Report is an in-depth analysis detailing your home's value as well as a comparison with similar homes in the area
Home Values in the Area
Average Home Value in this Area
Purchase History
| Date | Buyer | Sale Price | Title Company |
|---|---|---|---|
| Scholl Ada J | $315,000 | -- | |
| Kang Hang Woon | $285,000 | -- |
Source: Public Records
Mortgage History
| Date | Status | Borrower | Loan Amount |
|---|---|---|---|
| Open | Scholl Ada J | $227,150 | |
| Previous Owner | Kang Hang Woon | $170,000 |
Source: Public Records
Tax History Compared to Growth
Tax History
| Year | Tax Paid | Tax Assessment Tax Assessment Total Assessment is a certain percentage of the fair market value that is determined by local assessors to be the total taxable value of land and additions on the property. | Land | Improvement |
|---|---|---|---|---|
| 2024 | $10,649 | $48,001 | $15,938 | $32,063 |
| 2023 | $10,264 | $48,001 | $15,938 | $32,063 |
| 2022 | $10,264 | $48,001 | $15,938 | $32,063 |
| 2021 | $9,231 | $38,971 | $13,812 | $25,159 |
| 2020 | $9,145 | $38,971 | $13,812 | $25,159 |
| 2019 | $8,924 | $42,826 | $13,812 | $29,014 |
| 2018 | $8,817 | $39,233 | $12,218 | $27,015 |
| 2017 | $8,588 | $39,233 | $12,218 | $27,015 |
| 2016 | $8,948 | $42,340 | $12,218 | $30,122 |
| 2015 | $8,959 | $38,460 | $10,093 | $28,367 |
| 2014 | $8,759 | $38,460 | $10,093 | $28,367 |
| 2013 | $8,499 | $38,460 | $10,093 | $28,367 |
Source: Public Records
Map
Nearby Homes
- 2100 Pfingsten Rd
- 250 Violet Ln
- 240 Violet Ln
- 1611 Pfingsten Rd
- 2537 Woodland Dr
- 2810 Weller Ln
- 1421 Chartres Dr
- 1435 Pfingsten Rd
- 1445 Pfingsten Rd
- 3263 Doriann Dr
- 2411 Woodlawn Rd
- 3005 Highland Rd
- 3155 Kayjay Dr
- 2960 Willow Rd
- 1400 Kingsport Ct
- 2250 White Oak Dr
- 2416 Oak Ave
- 1341 Pfingsten Rd
- 3492 Whirlaway Dr
- 1331 Pfingsten Rd
- 2831 Aspen Rd
- 2851 Aspen Rd
- 2861 Aspen Rd
- 2821 Aspen Rd
- 2842 Aspen Rd
- 1943 Barberry Rd
- 2830 Woodmere Ct
- 1950 Heather Ln
- 1961 Heather Ln
- 2832 Woodmere Ct
- 2832 Woodmere Ct
- 2871 Aspen Rd
- 2828 Woodmere Ct
- 1948 Barberry Rd
- 1933 Barberry Rd
- 1930 Heather Ln
- 1951 Heather Ln
- 2881 Aspen Rd
- 2834 Woodmere Ct
- 2880 Aspen Rd