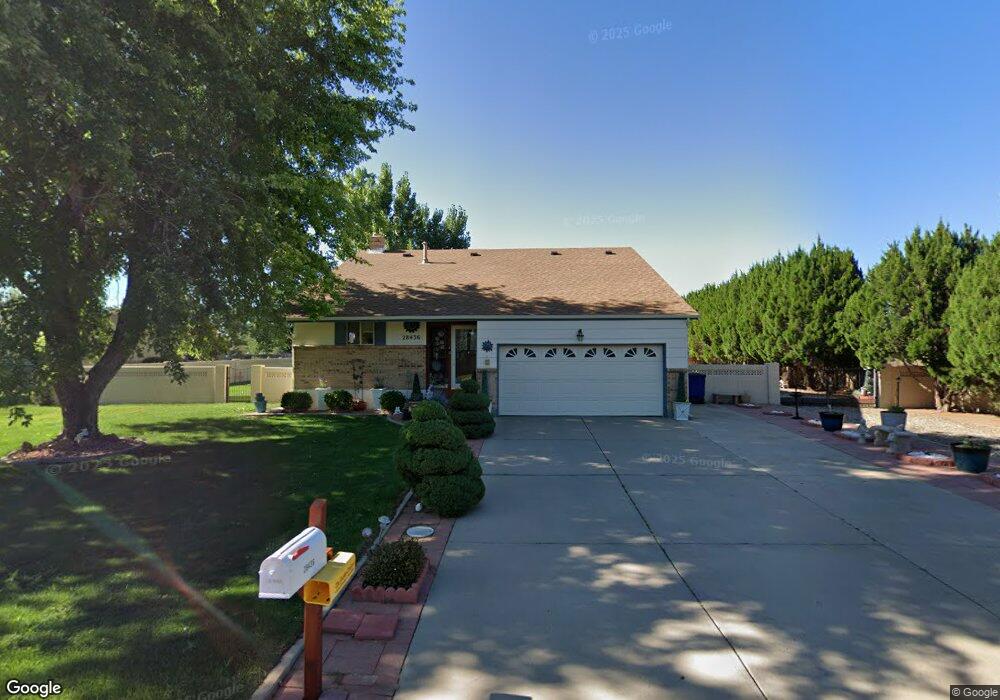
28436 Pongo Dr Pueblo, CO 81006
Estimated Value: $352,714 - $472,000
3
Beds
2
Baths
1,664
Sq Ft
$251/Sq Ft
Est. Value
About This Home
This home is located at 28436 Pongo Dr, Pueblo, CO 81006 and is currently estimated at $417,929, approximately $251 per square foot. 28436 Pongo Dr is a home located in Pueblo County with nearby schools including Vineland Elementary School, Vineland Middle School, and Pueblo County High School.
Ownership History
Date
Name
Owned For
Owner Type
Purchase Details
Closed on
Jan 17, 1997
Sold by
Comfort Matt + Deanne
Bought by
Ward Brent D + Sandra G Schus
Current Estimated Value
Purchase Details
Closed on
Jul 28, 1993
Sold by
Aggson Donna +
Bought by
Comfort Matt + Deanne
Purchase Details
Closed on
Feb 2, 1988
Sold by
Aggson Donna + Robert
Bought by
Aggson Donna +
Purchase Details
Closed on
Dec 14, 1984
Sold by
Aggson Robert
Bought by
Aggson Donna + Robert
Purchase Details
Closed on
Dec 8, 1982
Sold by
Tom Hall Building Corp Inc
Bought by
Aggson Robert
Purchase Details
Closed on
Aug 23, 1982
Sold by
Acacia Development Inc
Bought by
Tom Hall Building Corp Inc
Purchase Details
Closed on
Aug 27, 1979
Sold by
Finnigan George A + Josephine
Bought by
Jat Enterprises + Zinno T
Purchase Details
Closed on
Aug 23, 1979
Sold by
Jat Enterprises + Zinno T
Bought by
Acacia Development Inc
Create a Home Valuation Report for This Property
The Home Valuation Report is an in-depth analysis detailing your home's value as well as a comparison with similar homes in the area
Home Values in the Area
Average Home Value in this Area
Purchase History
| Date | Buyer | Sale Price | Title Company |
|---|---|---|---|
| Ward Brent D + Sandra G Schus | $140,000 | -- | |
| Comfort Matt + Deanne | $95,000 | -- | |
| Aggson Donna + | -- | -- | |
| Aggson Donna + Robert | -- | -- | |
| Aggson Robert | $70,000 | -- | |
| Tom Hall Building Corp Inc | $8,500 | -- | |
| Jat Enterprises + Zinno T | -- | -- | |
| Acacia Development Inc | -- | -- |
Source: Public Records
Tax History Compared to Growth
Tax History
| Year | Tax Paid | Tax Assessment Tax Assessment Total Assessment is a certain percentage of the fair market value that is determined by local assessors to be the total taxable value of land and additions on the property. | Land | Improvement |
|---|---|---|---|---|
| 2024 | $1,445 | $20,440 | -- | -- |
| 2023 | $1,461 | $24,130 | $1,880 | $22,250 |
| 2022 | $1,206 | $18,420 | $2,260 | $16,160 |
| 2021 | $1,236 | $18,950 | $2,330 | $16,620 |
| 2020 | $1,089 | $17,510 | $2,150 | $15,360 |
| 2019 | $1,086 | $17,507 | $2,145 | $15,362 |
| 2018 | $817 | $14,970 | $2,160 | $12,810 |
| 2017 | $818 | $14,970 | $2,160 | $12,810 |
| 2016 | $766 | $14,618 | $2,388 | $12,230 |
| 2015 | $381 | $14,618 | $2,388 | $12,230 |
| 2014 | $706 | $13,565 | $2,388 | $11,177 |
Source: Public Records
Map
Nearby Homes
- 1557 28th Ln
- 1470 Villa Spanada St
- 27454 Preston Rd
- 27875 County Farm Rd
- 1419 27 1 2 Ln
- Lot C Manning Rd
- Lot C Manning Rd
- 29767 Preston Rd
- 27111 Preston Rd
- TBD 27th Ln
- 27193 County Farm Rd
- 28513 Hillside Rd
- TBD Hillside Rd
- 1145 Wago Dr
- 1620 Johneva St
- 2074 Oriole Rd
- 1040 28th Ln
- 1725 Harlow Ave
- 1345 Terry Cir
- 29380 Windrow Dr
- 28474 Pongo Dr
- 28390 Pongo Dr
- 28435 South Rd
- 28473 South Rd
- 1592 Cliffdale Ln
- 28433 Pongo Dr
- 28475 Pongo Dr
- 28385 Pongo Dr
- 28320 Pongo Dr
- 28535 South Rd
- 28319 South Rd
- 28343 Pongo Dr
- 28274 Pongo Dr
- 1608 Cliffdale Ln
- 28569 South Rd
- 28297 Pongo Dr
- 28500 South Rd
- 28500 South Rd
- 28265 South Rd
- 28605 South Rd