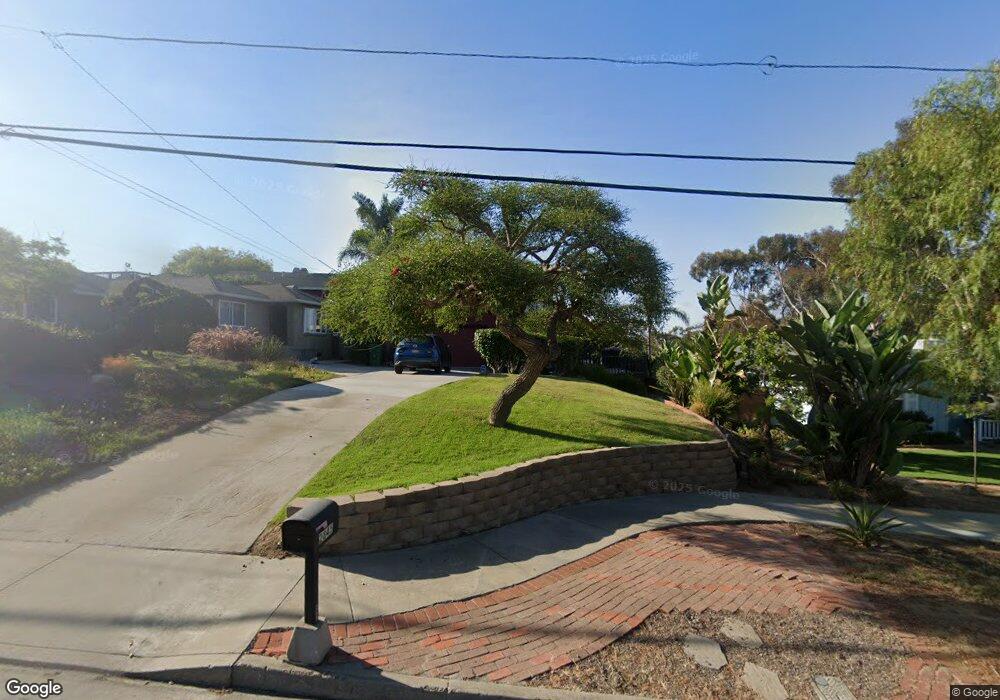
2845 Mesa Dr Oceanside, CA 92054
Loma Alta NeighborhoodEstimated Value: $942,909 - $1,063,000
3
Beds
3
Baths
1,461
Sq Ft
$683/Sq Ft
Est. Value
About This Home
This home is located at 2845 Mesa Dr, Oceanside, CA 92054 and is currently estimated at $997,727, approximately $682 per square foot. 2845 Mesa Dr is a home located in San Diego County with nearby schools including Lincoln Middle School, Oceanside High School, and Oceanside Adventist Elementary School.
Ownership History
Date
Name
Owned For
Owner Type
Purchase Details
Closed on
Sep 20, 2007
Sold by
Gersten John R and Gersten Shirley A
Bought by
Mayer Richard S and Schwider Germaine
Current Estimated Value
Home Financials for this Owner
Home Financials are based on the most recent Mortgage that was taken out on this home.
Original Mortgage
$352,000
Outstanding Balance
$220,912
Interest Rate
6.4%
Mortgage Type
Purchase Money Mortgage
Estimated Equity
$776,815
Purchase Details
Closed on
Sep 25, 2003
Sold by
Gersten John R and Gersten Shirley A
Bought by
Gersten John R and Gersten Shirley A
Purchase Details
Closed on
Jul 27, 1998
Sold by
Pena George M
Bought by
Gersten John R and Gersten Shirley A
Home Financials for this Owner
Home Financials are based on the most recent Mortgage that was taken out on this home.
Original Mortgage
$146,400
Interest Rate
6.88%
Purchase Details
Closed on
Jan 11, 1983
Create a Home Valuation Report for This Property
The Home Valuation Report is an in-depth analysis detailing your home's value as well as a comparison with similar homes in the area
Home Values in the Area
Average Home Value in this Area
Purchase History
| Date | Buyer | Sale Price | Title Company |
|---|---|---|---|
| Mayer Richard S | $445,000 | Ticor Title Company | |
| Gersten John R | -- | -- | |
| Gersten John R | $183,000 | First American Title | |
| -- | $83,500 | -- |
Source: Public Records
Mortgage History
| Date | Status | Borrower | Loan Amount |
|---|---|---|---|
| Open | Mayer Richard S | $352,000 | |
| Previous Owner | Gersten John R | $146,400 |
Source: Public Records
Tax History
| Year | Tax Paid | Tax Assessment Tax Assessment Total Assessment is a certain percentage of the fair market value that is determined by local assessors to be the total taxable value of land and additions on the property. | Land | Improvement |
|---|---|---|---|---|
| 2025 | $6,367 | $584,489 | $367,769 | $216,720 |
| 2024 | $6,367 | $573,029 | $360,558 | $212,471 |
| 2023 | $6,170 | $561,794 | $353,489 | $208,305 |
| 2022 | $6,075 | $550,779 | $346,558 | $204,221 |
| 2021 | $6,097 | $539,980 | $339,763 | $200,217 |
| 2020 | $5,908 | $534,445 | $336,280 | $198,165 |
| 2019 | $5,735 | $523,967 | $329,687 | $194,280 |
| 2018 | $5,672 | $513,694 | $323,223 | $190,471 |
| 2017 | $5,081 | $460,000 | $288,000 | $172,000 |
| 2016 | $3,914 | $360,000 | $226,000 | $134,000 |
| 2015 | $3,749 | $350,000 | $220,000 | $130,000 |
| 2014 | $3,421 | $326,000 | $205,000 | $121,000 |
Source: Public Records
Map
Nearby Homes
- 230 Hoover St
- 540 S Barnwell St
- 2721 Lomita St
- 519 Camelot Dr
- 2904 E Barnwell St
- 2861 Turnbull St
- 506 Canyon Dr Unit 6
- 403 Foussat Rd
- 2937 E Barnwell St
- 2309 Saratoga St
- 223 Cottingham Ct
- 168 Carey Rd
- 432 Edgehill Ln Unit 169
- 432 Edgehill Ln Unit 165
- 432 Edgehill Ln Unit 95
- 432 Edgehill Ln Unit 74
- 2277 Dunstan St
- 0 Amick St Unit 146-100-23-00, 21, 1
- 3218 Carolyn Cir
- 1305 Cornish Dr
- 2841 Mesa Dr
- 313 S Barnwell St
- 2849 Mesa Dr
- 315 S Barnwell St
- 2825 Mesa Dr
- 2821 Mesa Dr
- 323 S Barnwell St
- 2822 Mesa Dr
- 2818 Mesa Dr
- 2814 Mesa Dr
- 210 S Barnwell St
- 2815 Mesa Dr
- 102 S Barnwell St
- 105 N Barnwell St
- 220 S Barnwell St
- 2810 Mesa Dr
- 202 Hoover St
- 204 Hoover St
- 109 N Barnwell St
- 2806 Mesa Dr
Your Personal Tour Guide
Ask me questions while you tour the home.