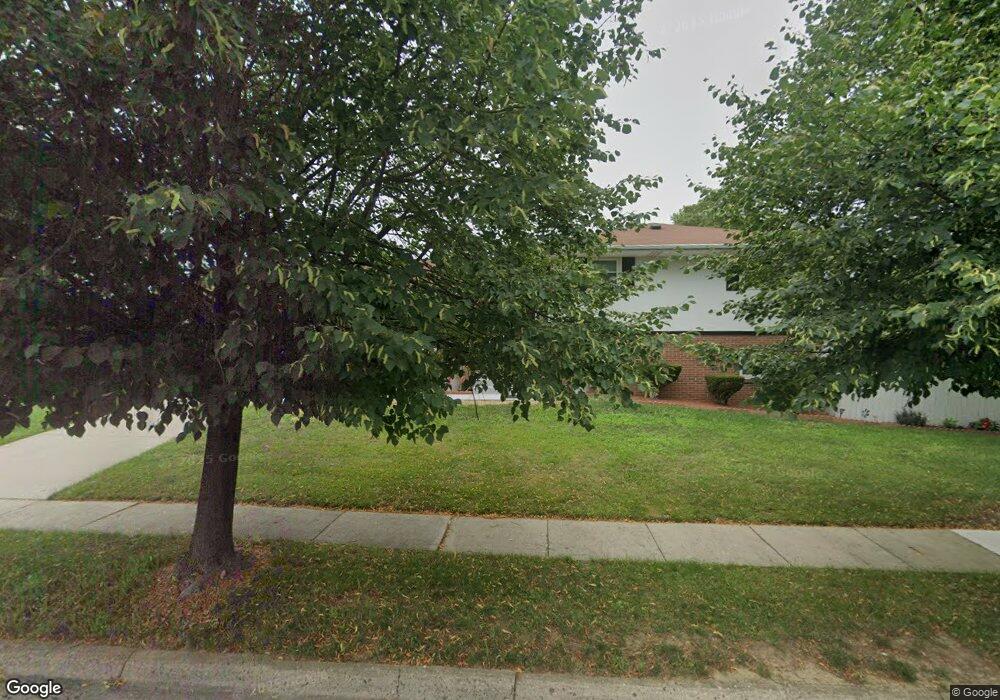
2846 Keystone Dr Columbus, OH 43209
Berwick NeighborhoodEstimated Value: $266,715 - $324,000
4
Beds
2
Baths
1,752
Sq Ft
$170/Sq Ft
Est. Value
About This Home
This home is located at 2846 Keystone Dr, Columbus, OH 43209 and is currently estimated at $298,429, approximately $170 per square foot. 2846 Keystone Dr is a home located in Franklin County with nearby schools including Berwick Alternative K-8 School, Walnut Ridge High School, and Whitehall Preparatory And Fitness Academy.
Ownership History
Date
Name
Owned For
Owner Type
Purchase Details
Closed on
Oct 29, 2024
Sold by
Carlock Maurice M
Bought by
Carlock Maurice M and Carlock Landa
Current Estimated Value
Home Financials for this Owner
Home Financials are based on the most recent Mortgage that was taken out on this home.
Original Mortgage
$292,450
Outstanding Balance
$288,332
Interest Rate
6.12%
Mortgage Type
VA
Estimated Equity
$10,097
Purchase Details
Closed on
Jul 29, 1997
Sold by
Flu Allen Barbara Carlock
Bought by
Carlock Maurice M and Carlock Maurice M
Create a Home Valuation Report for This Property
The Home Valuation Report is an in-depth analysis detailing your home's value as well as a comparison with similar homes in the area
Home Values in the Area
Average Home Value in this Area
Purchase History
| Date | Buyer | Sale Price | Title Company |
|---|---|---|---|
| Carlock Maurice M | -- | Lendmark Closing Services | |
| Carlock Maurice M | -- | Lendmark Closing Services | |
| Carlock Maurice M | $38,500 | Preferred Title Agency Inc |
Source: Public Records
Mortgage History
| Date | Status | Borrower | Loan Amount |
|---|---|---|---|
| Open | Carlock Maurice M | $292,450 | |
| Closed | Carlock Maurice M | $292,450 |
Source: Public Records
Tax History
| Year | Tax Paid | Tax Assessment Tax Assessment Total Assessment is a certain percentage of the fair market value that is determined by local assessors to be the total taxable value of land and additions on the property. | Land | Improvement |
|---|---|---|---|---|
| 2025 | $3,103 | $78,930 | $14,000 | $64,930 |
| 2024 | $3,103 | $78,930 | $14,000 | $64,930 |
| 2023 | $3,091 | $78,925 | $14,000 | $64,925 |
| 2022 | $1,692 | $41,370 | $7,560 | $33,810 |
| 2021 | $1,695 | $41,370 | $7,560 | $33,810 |
| 2020 | $1,697 | $41,370 | $7,560 | $33,810 |
| 2019 | $1,557 | $34,410 | $6,300 | $28,110 |
| 2018 | $1,491 | $34,410 | $6,300 | $28,110 |
| 2017 | $1,556 | $34,410 | $6,300 | $28,110 |
| 2016 | $1,575 | $32,520 | $4,900 | $27,620 |
| 2015 | $1,429 | $32,520 | $4,900 | $27,620 |
| 2014 | $1,433 | $32,520 | $4,900 | $27,620 |
| 2013 | $814 | $36,120 | $5,425 | $30,695 |
Source: Public Records
Map
Nearby Homes
- 2840 Manola Dr
- 1677 Kenview Rd
- 2731 Sonata Dr
- 1637 S James Rd
- 1679 Penfield Rd
- 2639 Halleck Dr
- 2813 Kingsrowe Ct Unit 43
- 1455 Wilmore Dr
- 1423 Cottingham Ct E
- 1341 Millerdale Rd
- 2942 Arrowhead Ct
- 1884 Barnett Ct W
- 2956 Castlewood Rd
- 3038 Wadsworth Ct
- 3036 Wadsworth Ct
- 2390 Village at Bexley Dr Unit 2390
- 3285 Scottwood Rd
- 2029 Burwell Dr Unit A
- 3325 E Deshler Ave
- 2433 Brookwood Rd
- 1656 Kenview Rd
- 2862 Keystone Dr
- 2845 Keystone Dr
- 1648 Kenview Rd
- 2870 Keystone Dr
- 2859 Keystone Dr
- 1686 Kenview Rd
- 1665 Kenview Rd
- 1657 Kenview Rd
- 2865 Langfield Dr
- 2851 Langfield Dr
- 1649 Kenview Rd
- 2867 Keystone Dr
- 2877 Langfield Dr
- 2878 Keystone Dr
- 1694 Kenview Rd
- 1683 Kenview Rd
- 1637 Kenview Rd
- 2875 Keystone Dr
- 2885 Langfield Dr
Your Personal Tour Guide
Ask me questions while you tour the home.