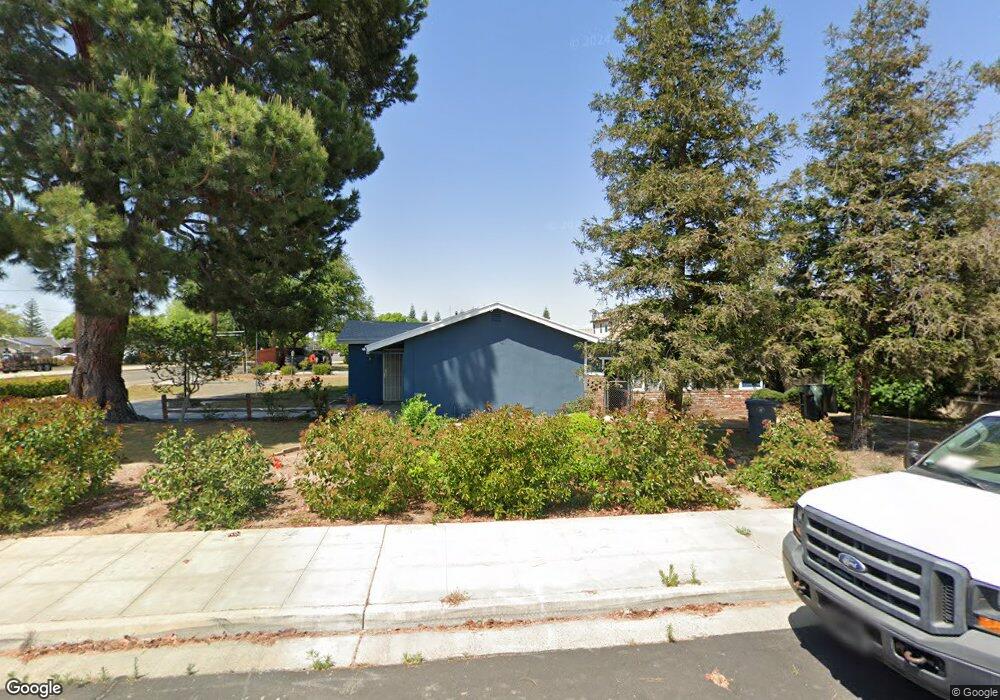
2847 Fowler Ave Clovis, CA 93611
Estimated Value: $317,000 - $374,410
3
Beds
1
Bath
968
Sq Ft
$358/Sq Ft
Est. Value
About This Home
This home is located at 2847 Fowler Ave, Clovis, CA 93611 and is currently estimated at $346,137, approximately $357 per square foot. 2847 Fowler Ave is a home located in Fresno County with nearby schools including Gettysburg Elementary School, Reyburn Intermediate School, and Clovis East High School.
Ownership History
Date
Name
Owned For
Owner Type
Purchase Details
Closed on
Aug 26, 2022
Sold by
Jennifer Beliveau
Bought by
Schutz Jared and Schutz Mercy G
Current Estimated Value
Home Financials for this Owner
Home Financials are based on the most recent Mortgage that was taken out on this home.
Original Mortgage
$315,000
Outstanding Balance
$299,377
Interest Rate
5.3%
Mortgage Type
New Conventional
Estimated Equity
$46,760
Purchase Details
Closed on
Dec 13, 2005
Sold by
Hayes Elton C and Hayes Eudean
Bought by
Hayes Elton C and Hayes Eudean
Purchase Details
Closed on
Nov 17, 2005
Sold by
Hayes Elton C and Hayes Eudean
Bought by
Seer Enterprises Inc
Purchase Details
Closed on
Aug 7, 2003
Sold by
Hayes Elton C and Hayes Eudean
Bought by
Hayes Elton C and Hayes Eudean
Create a Home Valuation Report for This Property
The Home Valuation Report is an in-depth analysis detailing your home's value as well as a comparison with similar homes in the area
Home Values in the Area
Average Home Value in this Area
Purchase History
| Date | Buyer | Sale Price | Title Company |
|---|---|---|---|
| Schutz Jared | $350,000 | Chicago Title | |
| Beliveau Jennifer | -- | Chicago Title | |
| Beliveau Jennifer | $208,000 | Chicago Title | |
| Hayes Elton C | -- | Fidelity National Title Co | |
| Seer Enterprises Inc | $525,000 | Fidelity National Title Co | |
| Hayes Elton C | -- | -- |
Source: Public Records
Mortgage History
| Date | Status | Borrower | Loan Amount |
|---|---|---|---|
| Open | Schutz Jared | $315,000 |
Source: Public Records
Tax History
| Year | Tax Paid | Tax Assessment Tax Assessment Total Assessment is a certain percentage of the fair market value that is determined by local assessors to be the total taxable value of land and additions on the property. | Land | Improvement |
|---|---|---|---|---|
| 2025 | $4,301 | $364,140 | $114,444 | $249,696 |
| 2023 | $4,137 | $350,000 | $110,000 | $240,000 |
| 2022 | $534 | $43,359 | $4,202 | $39,157 |
| 2021 | $519 | $42,510 | $4,120 | $38,390 |
| 2020 | $517 | $42,075 | $4,078 | $37,997 |
| 2019 | $508 | $41,251 | $3,999 | $37,252 |
| 2018 | $497 | $40,443 | $3,921 | $36,522 |
| 2017 | $489 | $39,651 | $3,845 | $35,806 |
| 2016 | $473 | $38,874 | $3,770 | $35,104 |
| 2015 | $466 | $38,291 | $3,714 | $34,577 |
| 2014 | $458 | $37,542 | $3,642 | $33,900 |
Source: Public Records
Map
Nearby Homes
- 1715 Donner Ave
- 1721 Holland Ave
- 2645 Fowler Ave
- 1707 Gettysburg Ave
- 2612 Renn Ave
- 1608 Gettysburg Ave
- 3074 Burgan Ave
- 3099 Ezie Ave
- 2627 Stanford Ave
- 1555 Pico Ave
- 3110 Ezie Ave
- 2468 Laverne Ave
- 1607 Ashlan Ave
- 2916 Miami Ave
- 3060 Evergreen Ave
- 1722 Buckingham Ave
- 2306 Stanford Ave
- 1488 Alamos Ave
- 2214 Fordham Ave
- 3497 Shaw Ave
Your Personal Tour Guide
Ask me questions while you tour the home.