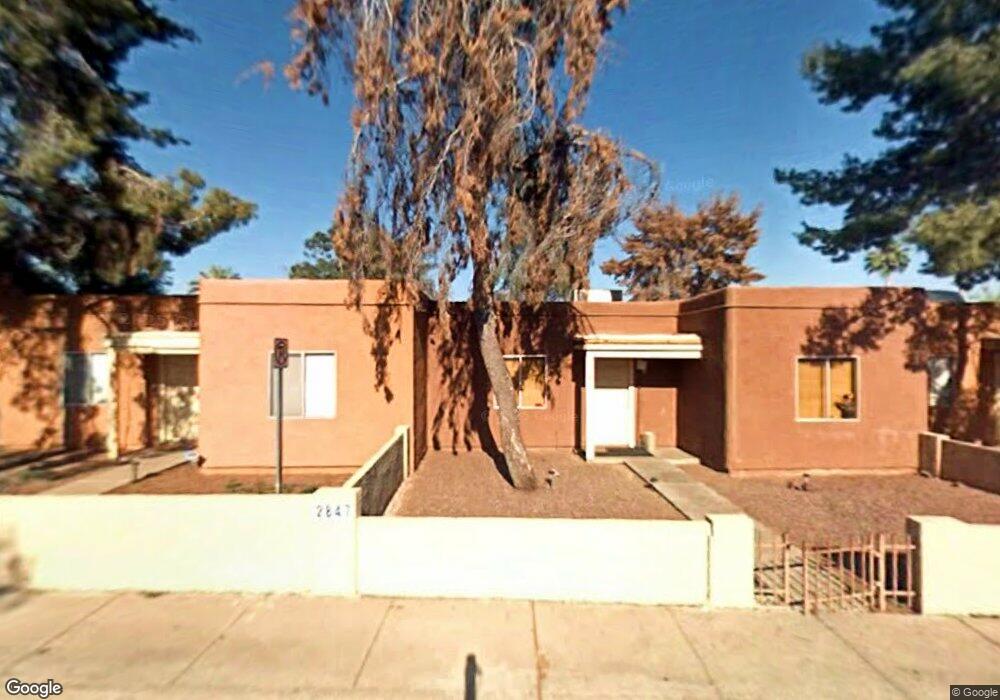
2847 N 46th Ave Unit 9 Phoenix, AZ 85035
Maryvale NeighborhoodEstimated Value: $134,220 - $218,000
2
Beds
1
Bath
1,000
Sq Ft
$164/Sq Ft
Est. Value
About This Home
This home is located at 2847 N 46th Ave Unit 9, Phoenix, AZ 85035 and is currently estimated at $163,555, approximately $163 per square foot. 2847 N 46th Ave Unit 9 is a home located in Maricopa County with nearby schools including Justine Spitalny School, Maryvale High School, and Phoenix Coding Academy.
Ownership History
Date
Name
Owned For
Owner Type
Purchase Details
Closed on
Oct 22, 2018
Sold by
Thin Z Man Llc
Bought by
Rivandi Amir
Current Estimated Value
Purchase Details
Closed on
Oct 4, 2018
Sold by
Thin Z Man Llc
Bought by
Rivandi Amir
Purchase Details
Closed on
Jun 23, 2008
Sold by
Ib Property Holdings Llc
Bought by
Hinzman Caroline
Purchase Details
Closed on
Mar 18, 2008
Sold by
Mendez Angel and Mendez Gabriela
Bought by
Bayview Loan Servicing Llc
Purchase Details
Closed on
Nov 10, 2004
Sold by
Kivas Uno Llc
Bought by
Payan Martin
Home Financials for this Owner
Home Financials are based on the most recent Mortgage that was taken out on this home.
Original Mortgage
$96,990
Interest Rate
5.79%
Mortgage Type
FHA
Create a Home Valuation Report for This Property
The Home Valuation Report is an in-depth analysis detailing your home's value as well as a comparison with similar homes in the area
Home Values in the Area
Average Home Value in this Area
Purchase History
We collect this data history from publicly available records. To have your information removed, we recommend requesting removal directly through your county’s website.
| Date | Buyer | Sale Price | Title Company |
|---|---|---|---|
| Rivandi Amir | -- | None Available | |
| Rivandi Amir | -- | None Available | |
| Hinzman Caroline | $38,500 | Chicago Title Insurance | |
| Ib Property Holdings Llc | -- | Chicago Title Insurance | |
| Bayview Loan Servicing Llc | $104,271 | First American Title | |
| Payan Martin | $99,990 | Dhi Title Of Arizona Inc |
Source: Public Records
Mortgage History
We collect this data history from publicly available records. To have your information removed, we recommend requesting removal directly through your county’s website.
| Date | Status | Borrower | Loan Amount |
|---|---|---|---|
| Previous Owner | Payan Martin | $96,990 |
Source: Public Records
Tax History
| Year | Tax Paid | Tax Assessment Tax Assessment Total Assessment is a certain percentage of the fair market value that is determined by local assessors to be the total taxable value of land and additions on the property. | Land | Improvement |
|---|---|---|---|---|
| 2025 | $397 | $2,271 | -- | -- |
| 2024 | $395 | $2,162 | -- | -- |
| 2023 | $395 | $9,050 | $1,810 | $7,240 |
| 2022 | $373 | $7,160 | $1,430 | $5,730 |
| 2021 | $377 | $5,610 | $1,120 | $4,490 |
| 2020 | $357 | $4,730 | $940 | $3,790 |
| 2019 | $342 | $3,420 | $680 | $2,740 |
| 2018 | $356 | $3,030 | $600 | $2,430 |
| 2017 | $344 | $2,860 | $570 | $2,290 |
| 2016 | $329 | $2,470 | $490 | $1,980 |
| 2015 | $307 | $2,550 | $510 | $2,040 |
Source: Public Records
Map
Nearby Homes
- 2847 N 46th Ave Unit 10
- 2846 N 46th Ave Unit 3
- 2690 N 43rd Ave Unit C
- 2690 N 43rd Ave Unit D
- 4427 W Catalina Dr
- 4338 W Thomas Rd
- 4625 W Thomas Rd Unit 39
- 4625 W Thomas Rd Unit 43
- 4625 W Thomas Rd Unit 76
- 2666 N 43rd Ave Unit C
- 2652 N 43rd Ave Unit C
- 2621 N 47th Dr
- 2815 N 48th Ln
- 2646 N 43rd Ave Unit B
- 2830 N 48th Ln
- 2525 N 47th Dr
- 2512 N 47th Dr
- 4407 W Monterey Way
- 2616 N 50th Ave
- 4244 W Vernon Ave
- 2847 N 46th Ave Unit 2847 N 46th Ave 13
- 2847 N 46th Ave Unit 3
- 2847 N 46th Ave Unit 11
- 2847 N 46th Ave Unit 22
- 2847 N 46th Ave Unit 19
- 2847 N 46th Ave Unit 13
- 2847 N 46th Ave Unit 15
- 2847 N 46th Ave Unit 20
- 2847 N 46th Ave Unit 5
- 2847 N 46th Ave Unit 17
- 2847 N 46th Ave Unit 1
- 2847 N 46th Ave Unit 2
- 2847 N 46th Ave Unit 18
- 2847 N 46th Ave Unit 6
- 2847 N 46th Ave Unit 8
- 2847 N 46th Ave Unit 4
- 2847 N 46th Ave Unit 7
- 2847 N 46th Ave Unit 16
- 2847 N 46th Ave Unit 21
- 2847 N 46th Ave Unit 14
Your Personal Tour Guide
Ask me questions while you tour the home.