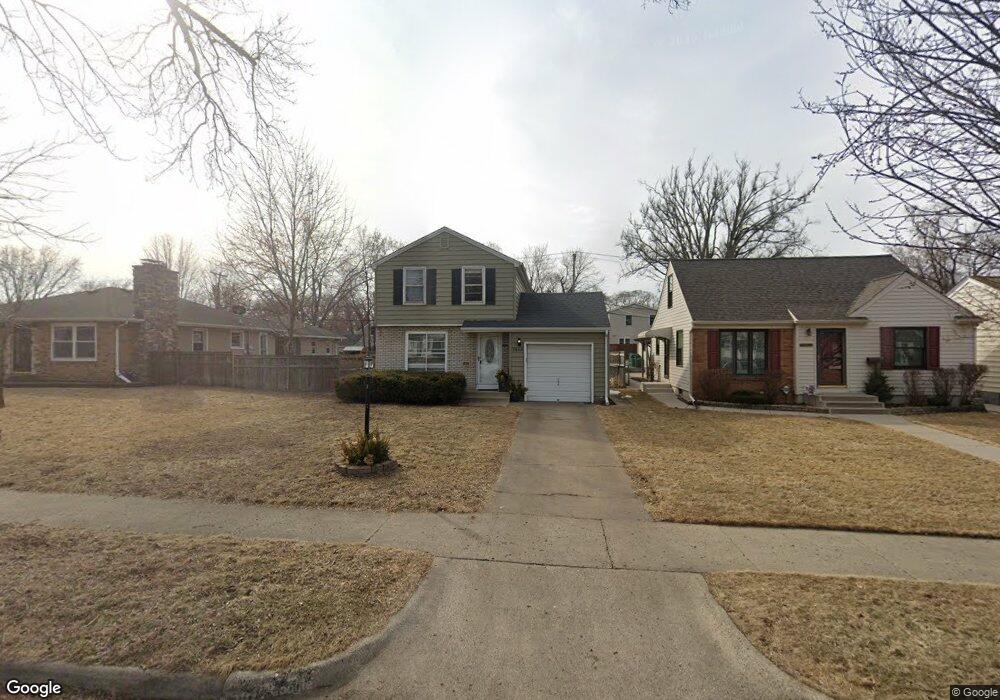
2848 Kentucky Ave S Saint Louis Park, MN 55426
Bronx Park NeighborhoodEstimated Value: $395,473 - $455,000
4
Beds
2
Baths
2,031
Sq Ft
$207/Sq Ft
Est. Value
About This Home
This home is located at 2848 Kentucky Ave S, Saint Louis Park, MN 55426 and is currently estimated at $420,618, approximately $207 per square foot. 2848 Kentucky Ave S is a home located in Hennepin County with nearby schools including Peter Hobart Elementary School, St. Louis Park Middle School, and St. Louis Park High School.
Ownership History
Date
Name
Owned For
Owner Type
Purchase Details
Closed on
Dec 1, 2023
Sold by
Git Naomi Chava
Bought by
2848 Kcjitud V Avemosouth Llc
Current Estimated Value
Purchase Details
Closed on
Jul 31, 2019
Sold by
Abramson Joseph H
Bought by
Git Naomi C
Home Financials for this Owner
Home Financials are based on the most recent Mortgage that was taken out on this home.
Original Mortgage
$234,000
Interest Rate
3.8%
Mortgage Type
New Conventional
Purchase Details
Closed on
Jun 30, 2017
Sold by
Gerhardson Sheri A
Bought by
Abramson Joseph H
Home Financials for this Owner
Home Financials are based on the most recent Mortgage that was taken out on this home.
Original Mortgage
$230,860
Interest Rate
3.94%
Mortgage Type
New Conventional
Purchase Details
Closed on
Oct 23, 2000
Sold by
Wilson Glenn N
Bought by
Gerhardson Sheri A
Create a Home Valuation Report for This Property
The Home Valuation Report is an in-depth analysis detailing your home's value as well as a comparison with similar homes in the area
Home Values in the Area
Average Home Value in this Area
Purchase History
| Date | Buyer | Sale Price | Title Company |
|---|---|---|---|
| 2848 Kcjitud V Avemosouth Llc | $500 | None Listed On Document | |
| Git Naomi C | $292,500 | Minnesota Title | |
| Abramson Joseph H | $238,000 | None Available | |
| Gerhardson Sheri A | $154,650 | -- |
Source: Public Records
Mortgage History
| Date | Status | Borrower | Loan Amount |
|---|---|---|---|
| Previous Owner | Git Naomi C | $234,000 | |
| Previous Owner | Abramson Joseph H | $230,860 |
Source: Public Records
Tax History Compared to Growth
Tax History
| Year | Tax Paid | Tax Assessment Tax Assessment Total Assessment is a certain percentage of the fair market value that is determined by local assessors to be the total taxable value of land and additions on the property. | Land | Improvement |
|---|---|---|---|---|
| 2024 | $5,309 | $378,300 | $129,100 | $249,200 |
| 2023 | $4,944 | $371,000 | $126,600 | $244,400 |
| 2022 | $4,316 | $383,200 | $126,000 | $257,200 |
| 2021 | $3,821 | $322,300 | $109,600 | $212,700 |
| 2020 | $3,914 | $288,000 | $104,400 | $183,600 |
| 2019 | $3,864 | $283,100 | $99,500 | $183,600 |
| 2018 | $3,601 | $269,700 | $94,800 | $174,900 |
| 2017 | $3,108 | $230,300 | $75,000 | $155,300 |
| 2016 | $3,222 | $230,000 | $67,800 | $162,200 |
| 2015 | $3,251 | $225,600 | $63,400 | $162,200 |
| 2014 | -- | $221,500 | $60,100 | $161,400 |
Source: Public Records
Map
Nearby Homes
- 2849 Jersey Ave S
- 2732 Idaho Ave S
- 7217 Minnetonka Blvd
- 2852 Hampshire Ave S
- 2620 Kentucky Ave S
- 2608 Kentucky Ave S
- 2622 Idaho Ave S
- 2925 Georgia Ave S
- 2700 Georgia Ave S
- 3101 Nevada Ave S
- 3124 Maryland Ave S
- 2910 Edgewood Ave S
- 2575 Quebec Ave S
- 3149 Nevada Ave S
- 3153 Nevada Ave S
- 6926 W 24th St
- 3056 Florida Ave S
- 6821 W 24th St
- 2707 Edgewood Ave S
- 2744 Dakota Ave S
- 2844 Kentucky Ave S
- 2854 Kentucky Ave S
- 2840 Kentucky Ave S
- 2845 2845 Kentucky Ave S
- 2853 2853 Kentucky-Avenue-s
- 2854 2854 Kentucky Ave S
- 2836 Kentucky Ave S
- 2836 Kentucky Ave S
- 2849 Louisiana Ave S
- 2853 Louisiana Ave S
- 2845 Louisiana Ave S
- 2836 2836 Kentucky-Avenue-s
- 2837 2837 Kentucky Ave S
- 2857 2857 Louisiana-Avenue-s
- 2845 Louisiana Ave S
- 2857 Louisiana Ave S
- 2841 2841 Louisiana-Avenue-s
- 2832 Kentucky Ave S
- 2841 Louisiana Ave S
- 2900 Kentucky Ave S