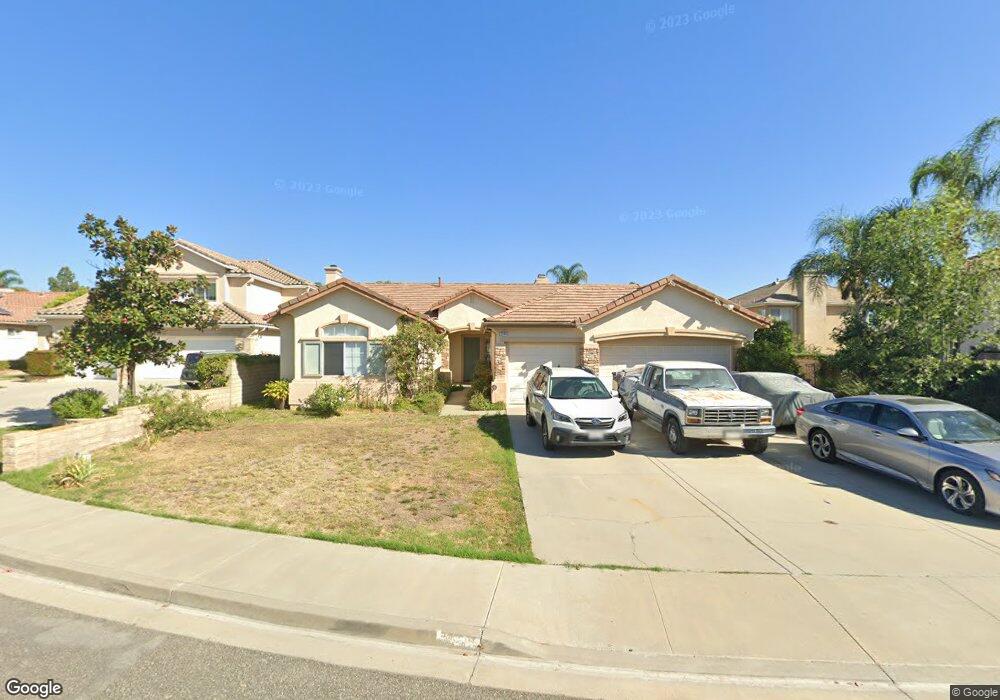
2848 Opal Ct Simi Valley, CA 93063
Central Simi Valley NeighborhoodEstimated Value: $1,017,072 - $1,117,000
3
Beds
3
Baths
2,455
Sq Ft
$432/Sq Ft
Est. Value
About This Home
This home is located at 2848 Opal Ct, Simi Valley, CA 93063 and is currently estimated at $1,060,018, approximately $431 per square foot. 2848 Opal Ct is a home located in Ventura County with nearby schools including Sycamore Elementary School, Valley View Middle School, and Simi Valley High School.
Ownership History
Date
Name
Owned For
Owner Type
Purchase Details
Closed on
Oct 30, 2014
Sold by
Villalovos Terence J and Villalovos Christina D
Bought by
Villalovos Family Trust and Villalovos Christina D
Current Estimated Value
Home Financials for this Owner
Home Financials are based on the most recent Mortgage that was taken out on this home.
Original Mortgage
$434,000
Outstanding Balance
$334,410
Interest Rate
4.16%
Mortgage Type
New Conventional
Estimated Equity
$725,608
Purchase Details
Closed on
Dec 16, 2010
Sold by
Villalovos Terence J and Villalovos Christina D
Bought by
Villalovos Terence J and Villalovos Christina D
Purchase Details
Closed on
Apr 1, 1997
Sold by
Emerald Heights Simi Valley Lp
Bought by
Villalovos Terence J and Villalovos Christina D
Home Financials for this Owner
Home Financials are based on the most recent Mortgage that was taken out on this home.
Original Mortgage
$248,550
Interest Rate
7.66%
Create a Home Valuation Report for This Property
The Home Valuation Report is an in-depth analysis detailing your home's value as well as a comparison with similar homes in the area
Home Values in the Area
Average Home Value in this Area
Purchase History
| Date | Buyer | Sale Price | Title Company |
|---|---|---|---|
| Villalovos Family Trust | -- | Title365 Company | |
| Villalovos Terence J | -- | Title365 Company | |
| Villalovos Terence J | -- | None Available | |
| Villalovos Terence J | $311,000 | Investors Title Company |
Source: Public Records
Mortgage History
| Date | Status | Borrower | Loan Amount |
|---|---|---|---|
| Open | Villalovos Terence J | $434,000 | |
| Closed | Villalovos Terence J | $248,550 |
Source: Public Records
Tax History
| Year | Tax Paid | Tax Assessment Tax Assessment Total Assessment is a certain percentage of the fair market value that is determined by local assessors to be the total taxable value of land and additions on the property. | Land | Improvement |
|---|---|---|---|---|
| 2025 | $6,516 | $506,010 | $202,398 | $303,612 |
| 2024 | $6,516 | $496,089 | $198,430 | $297,659 |
| 2023 | $6,144 | $486,362 | $194,539 | $291,823 |
| 2022 | $6,122 | $476,826 | $190,725 | $286,101 |
| 2021 | $6,081 | $467,477 | $186,985 | $280,492 |
| 2020 | $5,962 | $462,686 | $185,069 | $277,617 |
| 2019 | $5,704 | $453,615 | $181,441 | $272,174 |
| 2018 | $5,660 | $444,722 | $177,884 | $266,838 |
| 2017 | $5,541 | $436,003 | $174,397 | $261,606 |
| 2016 | $5,306 | $427,455 | $170,978 | $256,477 |
| 2015 | $5,201 | $421,035 | $168,410 | $252,625 |
| 2014 | $5,133 | $412,789 | $165,112 | $247,677 |
Source: Public Records
Map
Nearby Homes
- 3010 Tallahassee Ln
- 3049 Tallahassee Ln
- 6505 Canyon Oaks Dr
- 3279 Avenida Simi
- 3067 Harrison Ln
- 2832 Thicket Place
- 3028 Harrison Ln
- 3417 Highwood Ct Unit 148
- 3192 Darby St Unit 113
- 2671 Coral Gum Ln
- 3445 Highwood Ct Unit 128
- 3210 Darby St Unit 102
- 3434 Highwood Ct Unit 183
- 3458 Highwood Ct Unit 198
- 2781 N Woodrow Ave
- 3474 Highwood Ct Unit 80
- 2433 Medina Ave
- 2358 Medina Ave
- 2362 Medina Ave
- 2718 Licia Place
- 2862 Opal Ct
- 3145 Emerald Ave
- 3137 Emerald Ave
- 2876 Opal Ct
- 3148 Pebblestone Place
- 3149 Pebblestone Place
- 2890 Opal Ct
- 2849 Opal Ct
- 3162 Pebblestone Place
- 2863 Opal Ct
- 2898 Opal Ct
- 2835 Opal Ct
- 2877 Opal Ct
- 3146 Emerald Ave
- 2821 Opal Ct
- 3159 Emerald Ave
- 3140 Emerald Ave
- 2891 Opal Ct
- 3167 Pebblestone Place
- 3138 Emerald Ave
Your Personal Tour Guide
Ask me questions while you tour the home.