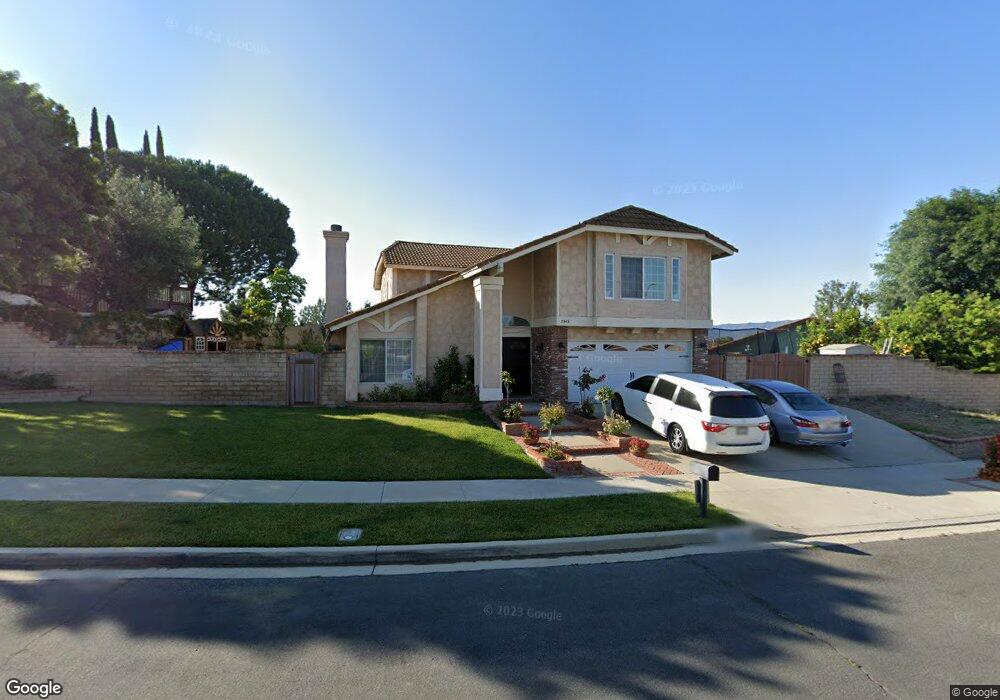
2848 Wanda Ave Simi Valley, CA 93065
Central Simi Valley NeighborhoodEstimated Value: $904,000 - $972,000
4
Beds
3
Baths
2,212
Sq Ft
$422/Sq Ft
Est. Value
About This Home
This home is located at 2848 Wanda Ave, Simi Valley, CA 93065 and is currently estimated at $933,026, approximately $421 per square foot. 2848 Wanda Ave is a home located in Ventura County with nearby schools including Atherwood Elementary School, Sinaloa Middle School, and Simi Valley High School.
Ownership History
Date
Name
Owned For
Owner Type
Purchase Details
Closed on
Sep 9, 2011
Sold by
Brown David M and Brown Carolyn P
Bought by
Brown David M and Brown Carolyn P
Current Estimated Value
Home Financials for this Owner
Home Financials are based on the most recent Mortgage that was taken out on this home.
Original Mortgage
$335,000
Outstanding Balance
$230,608
Interest Rate
4.37%
Mortgage Type
New Conventional
Estimated Equity
$702,418
Purchase Details
Closed on
Dec 29, 2008
Sold by
Hsbc Bank Usa
Bought by
Brown David and Ouellette Carolyn
Home Financials for this Owner
Home Financials are based on the most recent Mortgage that was taken out on this home.
Original Mortgage
$348,000
Interest Rate
5.49%
Mortgage Type
Purchase Money Mortgage
Purchase Details
Closed on
Jul 6, 2007
Sold by
Hunt Michael G
Bought by
Hsbc Bank Usa
Purchase Details
Closed on
Mar 13, 2007
Sold by
Panetta Kathryn A
Bought by
Hunt Michael G
Purchase Details
Closed on
Jun 23, 2006
Sold by
Hunt Michael G
Bought by
Hunt Michael G and Panetta Kathryn A
Purchase Details
Closed on
Jan 20, 2006
Sold by
Panetta Kathryn A
Bought by
Hunt Michael G
Home Financials for this Owner
Home Financials are based on the most recent Mortgage that was taken out on this home.
Original Mortgage
$140,800
Interest Rate
5.82%
Mortgage Type
Stand Alone Second
Purchase Details
Closed on
Jan 10, 2006
Sold by
Borden Marc H and Borden Sherri
Bought by
Hunt Michael G
Home Financials for this Owner
Home Financials are based on the most recent Mortgage that was taken out on this home.
Original Mortgage
$140,800
Interest Rate
5.82%
Mortgage Type
Stand Alone Second
Purchase Details
Closed on
Nov 4, 2005
Sold by
Borden Marc H
Bought by
Borden Marc H and Borden Sherri
Home Financials for this Owner
Home Financials are based on the most recent Mortgage that was taken out on this home.
Original Mortgage
$413,000
Interest Rate
5.68%
Mortgage Type
Stand Alone First
Purchase Details
Closed on
Oct 14, 2005
Sold by
Borden Shern
Bought by
Borden Marc H
Home Financials for this Owner
Home Financials are based on the most recent Mortgage that was taken out on this home.
Original Mortgage
$413,000
Interest Rate
5.68%
Mortgage Type
Stand Alone First
Purchase Details
Closed on
Sep 27, 2005
Sold by
Walsh Steven C and Walsh Johanna
Bought by
Borden Marc H
Home Financials for this Owner
Home Financials are based on the most recent Mortgage that was taken out on this home.
Original Mortgage
$413,000
Interest Rate
5.68%
Mortgage Type
Stand Alone First
Create a Home Valuation Report for This Property
The Home Valuation Report is an in-depth analysis detailing your home's value as well as a comparison with similar homes in the area
Home Values in the Area
Average Home Value in this Area
Purchase History
| Date | Buyer | Sale Price | Title Company |
|---|---|---|---|
| Brown David M | -- | Fidelity National Title | |
| Brown David | $435,000 | Multiple | |
| Hsbc Bank Usa | $593,732 | Accommodation | |
| Hunt Michael G | -- | Chicago Title Co | |
| Hunt Michael G | -- | None Available | |
| Hunt Michael G | -- | Stewart Title Of Ca Inc | |
| Hunt Michael G | $704,000 | Stewart Title Of Ca Inc | |
| Borden Marc H | -- | -- | |
| Borden Marc H | -- | Stewart Title Of Ca Inc | |
| Borden Marc H | $590,000 | Stewart Title Of Ca Inc |
Source: Public Records
Mortgage History
| Date | Status | Borrower | Loan Amount |
|---|---|---|---|
| Open | Brown David M | $335,000 | |
| Closed | Brown David | $348,000 | |
| Previous Owner | Hunt Michael G | $140,800 | |
| Previous Owner | Hunt Michael G | $563,200 | |
| Previous Owner | Borden Marc H | $413,000 |
Source: Public Records
Tax History Compared to Growth
Tax History
| Year | Tax Paid | Tax Assessment Tax Assessment Total Assessment is a certain percentage of the fair market value that is determined by local assessors to be the total taxable value of land and additions on the property. | Land | Improvement |
|---|---|---|---|---|
| 2025 | $6,877 | $560,154 | $280,078 | $280,076 |
| 2024 | $6,877 | $549,171 | $274,586 | $274,585 |
| 2023 | $6,474 | $538,403 | $269,202 | $269,201 |
| 2022 | $6,453 | $527,847 | $263,924 | $263,923 |
| 2021 | $6,411 | $517,498 | $258,749 | $258,749 |
| 2020 | $6,283 | $512,194 | $256,097 | $256,097 |
| 2019 | $6,003 | $502,152 | $251,076 | $251,076 |
| 2018 | $5,956 | $492,306 | $246,153 | $246,153 |
| 2017 | $5,829 | $482,654 | $241,327 | $241,327 |
| 2016 | $5,573 | $473,192 | $236,596 | $236,596 |
| 2015 | $5,461 | $466,086 | $233,043 | $233,043 |
| 2014 | $5,388 | $456,958 | $228,479 | $228,479 |
Source: Public Records
Map
Nearby Homes
- 2752 Wanda Ave
- 2719 Licia Place
- 2718 Licia Place
- 2649 Nicholas St
- 2679 Velma Ct
- 2148 Stoneman St
- 2442 N Alden St
- 2355 E Alden St
- 2660 Tumbleweed Ave
- 2877 Avenida Simi
- 2753 Deerwood Ave
- 2650 Belburn Place
- 2063 Woodglen St
- 3049 Reservoir Dr
- 2410 N Justin Ave
- 2320 Lupin St
- 2306 Madrone St
- 2357 Lawnview Ct
- 1807 Stoneman St