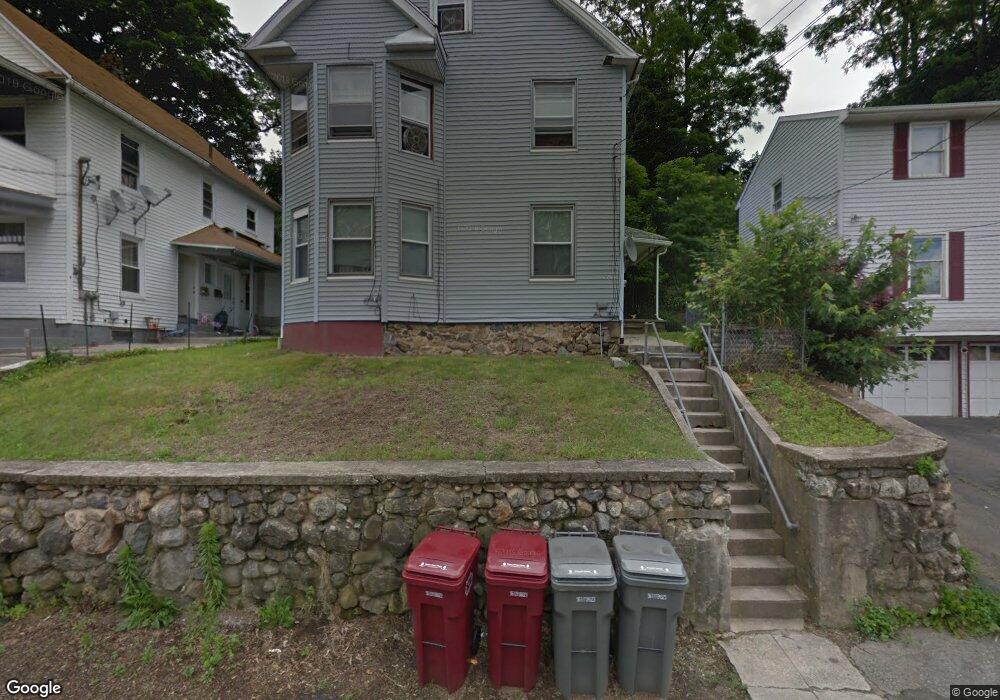
285 High St Naugatuck, CT 06770
Estimated Value: $329,989 - $404,000
5
Beds
2
Baths
1,742
Sq Ft
$209/Sq Ft
Est. Value
About This Home
This home is located at 285 High St, Naugatuck, CT 06770 and is currently estimated at $364,247, approximately $209 per square foot. 285 High St is a home located in New Haven County with nearby schools including City Hill Middle School and Naugatuck High School.
Ownership History
Date
Name
Owned For
Owner Type
Purchase Details
Closed on
Aug 28, 2008
Sold by
Lasalle Bank Na
Bought by
Rabbi Properties Llc
Current Estimated Value
Purchase Details
Closed on
May 12, 2006
Sold by
Castano Maria
Bought by
Almeida Gilson C
Purchase Details
Closed on
Sep 3, 2004
Sold by
Monteiro Raimundo M
Bought by
Castano Maria
Purchase Details
Closed on
Mar 1, 2001
Sold by
Lungarini Robert and Lungarini Lauren
Bought by
Monteiro Raimundo and Monteiro Almerinda
Create a Home Valuation Report for This Property
The Home Valuation Report is an in-depth analysis detailing your home's value as well as a comparison with similar homes in the area
Home Values in the Area
Average Home Value in this Area
Purchase History
| Date | Buyer | Sale Price | Title Company |
|---|---|---|---|
| Rabbi Properties Llc | $82,500 | -- | |
| Almeida Gilson C | $280,000 | -- | |
| Castano Maria | $142,000 | -- | |
| Monteiro Raimundo | $94,500 | -- |
Source: Public Records
Mortgage History
| Date | Status | Borrower | Loan Amount |
|---|---|---|---|
| Open | Monteiro Raimundo | $330,326 | |
| Closed | Monteiro Raimundo | $125,000 |
Source: Public Records
Tax History Compared to Growth
Tax History
| Year | Tax Paid | Tax Assessment Tax Assessment Total Assessment is a certain percentage of the fair market value that is determined by local assessors to be the total taxable value of land and additions on the property. | Land | Improvement |
|---|---|---|---|---|
| 2025 | $5,036 | $126,560 | $16,940 | $109,620 |
| 2024 | $5,289 | $126,560 | $16,940 | $109,620 |
| 2023 | $5,664 | $126,560 | $16,940 | $109,620 |
| 2022 | $4,472 | $93,660 | $14,240 | $79,420 |
| 2021 | $4,472 | $93,660 | $14,240 | $79,420 |
| 2020 | $4,472 | $93,660 | $14,240 | $79,420 |
| 2019 | $4,425 | $93,660 | $14,240 | $79,420 |
| 2018 | $3,770 | $77,970 | $26,650 | $51,320 |
| 2017 | $3,785 | $77,970 | $26,650 | $51,320 |
| 2016 | $3,717 | $77,970 | $26,650 | $51,320 |
| 2015 | $3,553 | $77,970 | $26,650 | $51,320 |
| 2014 | $3,513 | $77,970 | $26,650 | $51,320 |
| 2012 | $4,721 | $140,720 | $43,260 | $97,460 |
Source: Public Records
Map
Nearby Homes