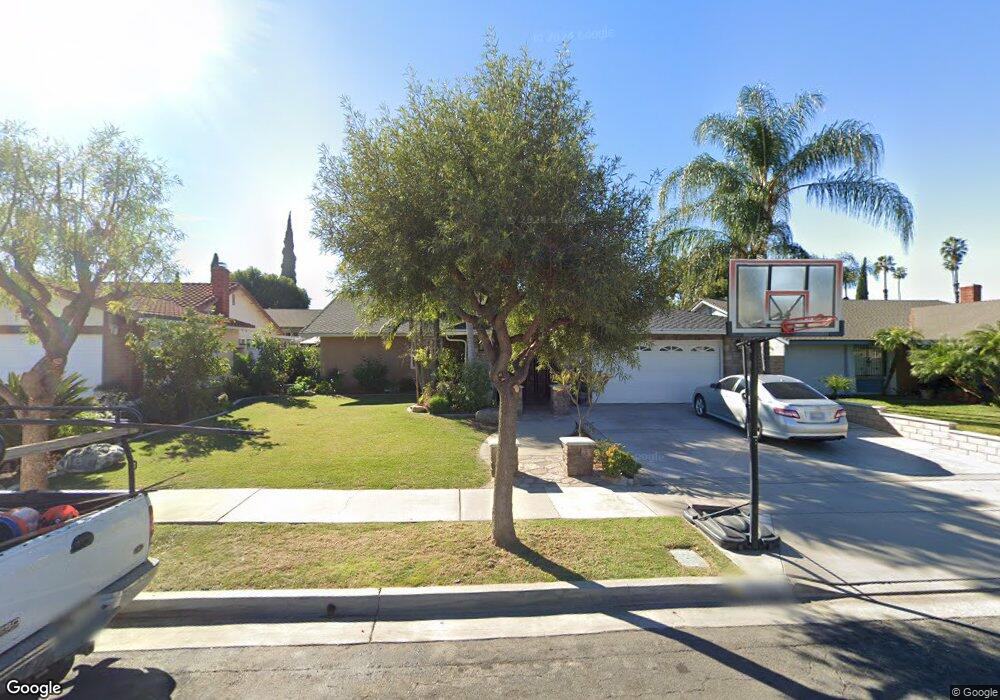
2850 Cascabel Way Riverside, CA 92503
Presidential Park NeighborhoodEstimated Value: $629,000 - $686,000
5
Beds
2
Baths
1,698
Sq Ft
$382/Sq Ft
Est. Value
About This Home
This home is located at 2850 Cascabel Way, Riverside, CA 92503 and is currently estimated at $648,751, approximately $382 per square foot. 2850 Cascabel Way is a home located in Riverside County with nearby schools including Hawthorne Elementary School, Chemawa Middle School, and Arlington High School.
Ownership History
Date
Name
Owned For
Owner Type
Purchase Details
Closed on
Nov 15, 2011
Sold by
Villanueva Alejandro
Bought by
Salgado Roberto and Flores Maribel
Current Estimated Value
Home Financials for this Owner
Home Financials are based on the most recent Mortgage that was taken out on this home.
Original Mortgage
$193,000
Outstanding Balance
$130,614
Interest Rate
3.94%
Mortgage Type
FHA
Estimated Equity
$518,137
Purchase Details
Closed on
Oct 15, 2005
Sold by
Villanueva Sonia
Bought by
Villanueva Alejandro
Home Financials for this Owner
Home Financials are based on the most recent Mortgage that was taken out on this home.
Original Mortgage
$373,500
Interest Rate
5.68%
Mortgage Type
Fannie Mae Freddie Mac
Purchase Details
Closed on
Sep 22, 2005
Sold by
Terra Associates
Bought by
Villanueva Alejandro
Home Financials for this Owner
Home Financials are based on the most recent Mortgage that was taken out on this home.
Original Mortgage
$373,500
Interest Rate
5.68%
Mortgage Type
Fannie Mae Freddie Mac
Create a Home Valuation Report for This Property
The Home Valuation Report is an in-depth analysis detailing your home's value as well as a comparison with similar homes in the area
Home Values in the Area
Average Home Value in this Area
Purchase History
| Date | Buyer | Sale Price | Title Company |
|---|---|---|---|
| Salgado Roberto | $200,000 | Nations Title Company | |
| Villanueva Alejandro | -- | Orange Coast Title Company | |
| Villanueva Alejandro | $415,000 | Orange Coast Title Company |
Source: Public Records
Mortgage History
| Date | Status | Borrower | Loan Amount |
|---|---|---|---|
| Open | Salgado Roberto | $193,000 | |
| Previous Owner | Villanueva Alejandro | $373,500 |
Source: Public Records
Tax History
| Year | Tax Paid | Tax Assessment Tax Assessment Total Assessment is a certain percentage of the fair market value that is determined by local assessors to be the total taxable value of land and additions on the property. | Land | Improvement |
|---|---|---|---|---|
| 2025 | $2,761 | $251,197 | $75,355 | $175,842 |
| 2023 | $2,761 | $241,445 | $72,430 | $169,015 |
| 2022 | $2,699 | $236,711 | $71,010 | $165,701 |
| 2021 | $2,673 | $232,070 | $69,618 | $162,452 |
| 2020 | $2,653 | $229,692 | $68,905 | $160,787 |
| 2019 | $2,604 | $225,189 | $67,554 | $157,635 |
| 2018 | $2,554 | $220,775 | $66,231 | $154,544 |
| 2017 | $2,509 | $216,447 | $64,933 | $151,514 |
| 2016 | $2,350 | $212,204 | $63,660 | $148,544 |
| 2015 | $2,317 | $209,017 | $62,704 | $146,313 |
| 2014 | $2,295 | $204,925 | $61,477 | $143,448 |
Source: Public Records
Map
Nearby Homes
- 2845 Roncador Place
- 2831 Carma Ct
- 8718 Lincoln Ave
- 3048 Strassbourg Dr
- 0 Jackson St
- 3181 Teralina Cir
- 3175 Teralina Cir
- 3185 Teralina Cir
- 3179 Teralina Cir
- 2850 Monroe St
- 3198 Bexfield Ct
- 8864 Haskell St
- 9187 Waverly Ln
- 9191 Waverly Ln
- 9195 Waverly Ln
- 9199 Waverly Ln
- 3190 Madrone Ln
- 9194 Connolly Ln
- 9198 Connolly Ln
- 9186 Connolly Ln
- 2860 Cascabel Way
- 2840 Cascabel Way
- 2855 Roncador Place
- 2865 Roncador Place
- 2870 Cascabel Way
- 2828 Cascabel Way
- 2875 Roncador Place
- 2835 Roncador Place
- 2855 Cascabel Way
- 2845 Cascabel Way
- 2865 Cascabel Way
- 2882 Cascabel Way
- 2835 Cascabel Way
- 2875 Cascabel Way
- 2885 Roncador Place
- 2885 Cascabel Way
- 2850 Roncador Place
- 2860 Roncador Place
- 2852 Bragg St
- 2840 Roncador Place
Your Personal Tour Guide
Ask me questions while you tour the home.