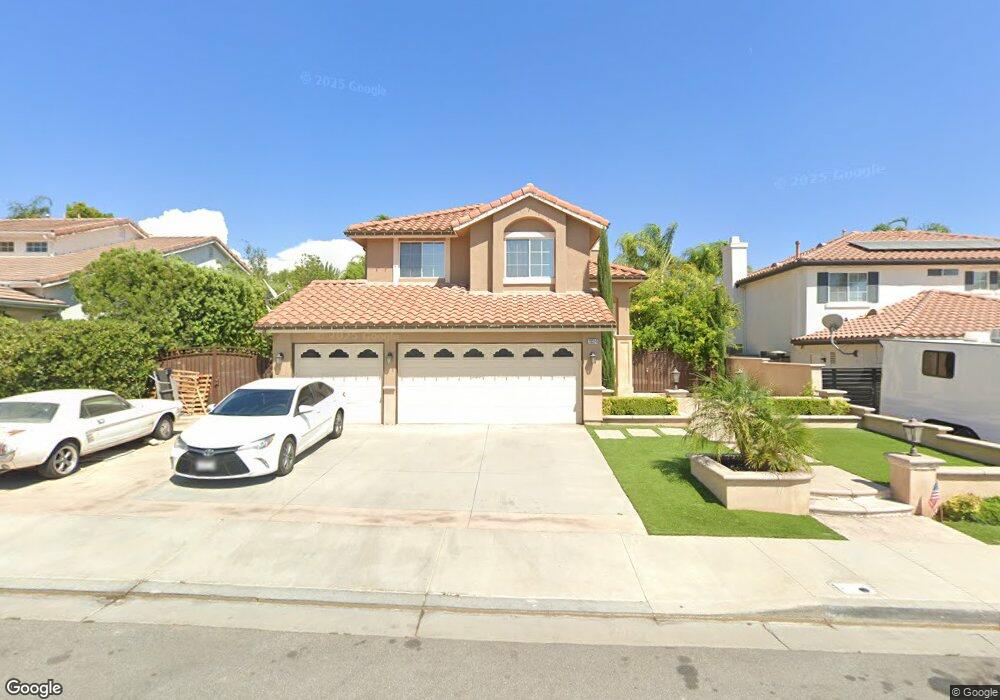
28514 Shana Place Santa Clarita, CA 91350
Estimated Value: $986,000 - $1,031,000
5
Beds
3
Baths
2,395
Sq Ft
$418/Sq Ft
Est. Value
About This Home
This home is located at 28514 Shana Place, Santa Clarita, CA 91350 and is currently estimated at $1,002,082, approximately $418 per square foot. 28514 Shana Place is a home located in Los Angeles County with nearby schools including Plum Canyon Elementary School, Arroyo Seco Junior High School, and Saugus High School.
Ownership History
Date
Name
Owned For
Owner Type
Purchase Details
Closed on
Feb 23, 2024
Sold by
Ramirez Victor and Ramirez Georgina
Bought by
Ramirez Family Trust and Ramirez
Current Estimated Value
Purchase Details
Closed on
Jul 16, 2008
Sold by
Goldberg Leonard M and Goldberg Karen G
Bought by
Ramirez Victor and Ramirez Rivera Georgina
Home Financials for this Owner
Home Financials are based on the most recent Mortgage that was taken out on this home.
Original Mortgage
$417,000
Interest Rate
6.42%
Mortgage Type
Purchase Money Mortgage
Purchase Details
Closed on
Sep 11, 1998
Sold by
Shapell Monteverde Partnership
Bought by
Goldberg Leonard M and Goldberg Karen G
Home Financials for this Owner
Home Financials are based on the most recent Mortgage that was taken out on this home.
Original Mortgage
$257,350
Interest Rate
6.84%
Create a Home Valuation Report for This Property
The Home Valuation Report is an in-depth analysis detailing your home's value as well as a comparison with similar homes in the area
Home Values in the Area
Average Home Value in this Area
Purchase History
| Date | Buyer | Sale Price | Title Company |
|---|---|---|---|
| Ramirez Family Trust | -- | None Listed On Document | |
| Ramirez Victor | $540,000 | Lawyers Title | |
| Goldberg Leonard M | $321,500 | Chicago Title |
Source: Public Records
Mortgage History
| Date | Status | Borrower | Loan Amount |
|---|---|---|---|
| Previous Owner | Ramirez Victor | $417,000 | |
| Previous Owner | Goldberg Leonard M | $257,350 | |
| Closed | Goldberg Leonard M | $48,300 |
Source: Public Records
Tax History Compared to Growth
Tax History
| Year | Tax Paid | Tax Assessment Tax Assessment Total Assessment is a certain percentage of the fair market value that is determined by local assessors to be the total taxable value of land and additions on the property. | Land | Improvement |
|---|---|---|---|---|
| 2025 | $9,666 | $695,375 | $258,831 | $436,544 |
| 2024 | $9,666 | $681,741 | $253,756 | $427,985 |
| 2023 | $9,298 | $668,375 | $248,781 | $419,594 |
| 2022 | $9,377 | $655,270 | $243,903 | $411,367 |
| 2021 | $9,217 | $642,422 | $239,121 | $403,301 |
| 2019 | $8,904 | $623,370 | $232,030 | $391,340 |
| 2018 | $8,684 | $611,148 | $227,481 | $383,667 |
| 2016 | $8,229 | $587,419 | $218,649 | $368,770 |
| 2015 | $7,936 | $578,596 | $215,365 | $363,231 |
| 2014 | $7,360 | $528,900 | $196,200 | $332,700 |
Source: Public Records
Map
Nearby Homes
- 20325 Tamara Place
- 19924 Via Joyce Dr
- 19749 Lanfranca Dr
- 20071 Carson Ct
- 20171 Zimmerman Place
- 20220 Arthur Ct
- 0 Plum Canyon Rd
- 28723 Park Woodland Place
- 28852 Woodside Dr
- 28741 Park Woodland Place
- 19735 Edmonds Place
- 19537 Griffith Dr
- 20000 Plum Canyon Rd Unit 221
- 20000 Plum Canyon Rd Unit 1324
- 20000 Plum Canyon Rd Unit 1827
- 20623 Russ Jay St
- 19515 Lanfranca Dr
- 0 Shadow Valley Ln Unit 25533363
- 0 Shadow Valley Ln Unit 225000929
- 28166 Robin Ave
- 28522 Shana Place
- 28508 Shana Place
- 28477 Rodgers Dr
- 28534 Shana Place
- 28544 Shana Place
- 28511 Shana Place
- 28481 Rodgers Dr
- 28517 Shana Place
- 28505 Shana Place
- 28548 Shana Place
- 28523 Shana Place
- 28476 Rodgers Dr
- 28464 Rodgers Dr
- 28527 Shana Place
- 28470 Rodgers Dr
- 28482 Rodgers Dr
- 28468 Rodgers Dr
- 28507 Leong Ct
- 28451 Rodgers Dr
- 28511 Leong Ct