Estimated Value: $433,000 - $496,000
4
Beds
2
Baths
1,407
Sq Ft
$321/Sq Ft
Est. Value
About This Home
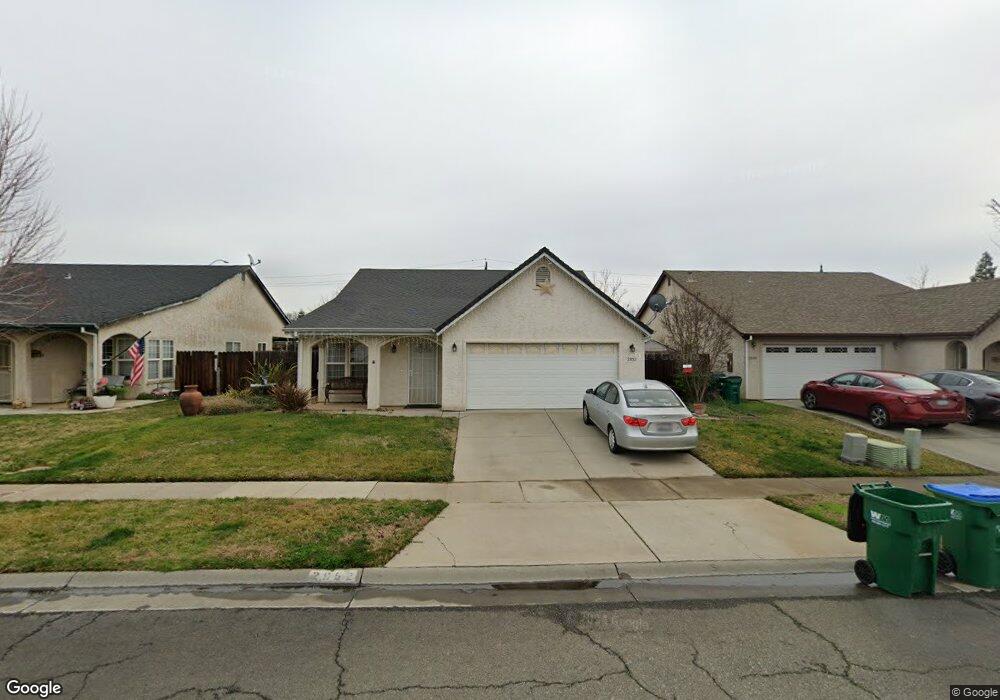
This home is located at 2852 Upland Dr, Chico, CA 95973 and is currently estimated at $451,011, approximately $320 per square foot. 2852 Upland Dr is a home located in Butte County with nearby schools including McManus (John A.) Elementary School, Bidwell Junior High School, and Pleasant Valley High School.
Ownership History
Date
Name
Owned For
Owner Type
Purchase Details
Closed on
Oct 4, 2021
Sold by
Lucinda Delancy
Bought by
Mcculley Katie
Current Estimated Value
Purchase Details
Closed on
Sep 15, 2002
Sold by
Mcculley Michael P
Bought by
Mcculley Michael P and Mcculley Lucinda
Home Financials for this Owner
Home Financials are based on the most recent Mortgage that was taken out on this home.
Original Mortgage
$42,800
Interest Rate
6.16%
Mortgage Type
Credit Line Revolving
Purchase Details
Closed on
Dec 7, 1999
Sold by
Mcculley Lucinda
Bought by
Mcculley Michael P
Home Financials for this Owner
Home Financials are based on the most recent Mortgage that was taken out on this home.
Original Mortgage
$104,632
Interest Rate
7.82%
Create a Home Valuation Report for This Property
The Home Valuation Report is an in-depth analysis detailing your home's value as well as a comparison with similar homes in the area
Purchase History
| Date | Buyer | Sale Price | Title Company |
|---|---|---|---|
| Mcculley Katie | -- | Harris & Plottel Llp | |
| Mcculley Michael P | -- | Mid Valley Title & Escrow Co | |
| Mcculley Michael P | -- | Fidelity National Title | |
| Mcculley Michael P | $131,000 | Fidelity National Title |
Source: Public Records
Mortgage History
| Date | Status | Borrower | Loan Amount |
|---|---|---|---|
| Previous Owner | Mcculley Michael P | $42,800 | |
| Previous Owner | Mcculley Michael P | $104,632 | |
| Closed | Mcculley Michael P | $17,158 |
Source: Public Records
Tax History
| Year | Tax Paid | Tax Assessment Tax Assessment Total Assessment is a certain percentage of the fair market value that is determined by local assessors to be the total taxable value of land and additions on the property. | Land | Improvement |
|---|---|---|---|---|
| 2025 | $4,382 | $403,258 | $180,405 | $222,853 |
| 2024 | $4,382 | $395,352 | $176,868 | $218,484 |
| 2023 | $4,413 | $387,600 | $173,400 | $214,200 |
| 2022 | $4,253 | $380,000 | $170,000 | $210,000 |
| 2021 | $2,109 | $185,567 | $58,207 | $127,360 |
| 2020 | $2,112 | $183,666 | $57,611 | $126,055 |
| 2019 | $2,071 | $180,066 | $56,482 | $123,584 |
| 2018 | $2,033 | $176,536 | $55,375 | $121,161 |
| 2017 | $2,047 | $173,076 | $54,290 | $118,786 |
| 2016 | $1,878 | $169,683 | $53,226 | $116,457 |
| 2015 | $1,901 | $167,135 | $52,427 | $114,708 |
| 2014 | $1,840 | $163,863 | $51,401 | $112,462 |
Source: Public Records
Map
Nearby Homes
- 170 Artesia Dr
- 34 Garden Park Dr
- 29 Glenshire Ln
- 16 Tierra Rosa Ln
- 5 Glenshire Ln
- 2748 Ceres Ave
- 2754 Ceres Ave
- 1281 Ravenshoe Way
- 16 Silkwood Way
- 19 Via Verona Cir
- 2840 Swallowtail Way
- 2556 Mariposa Ave
- 3001 Ashburton Ln
- 50 Casa Del Rey Ct
- 3 Sunflower Ct
- 2749 Ceanothus Ave
- 13 Avante Way
- 9 Gazania Ct
- 1261 Parque Dr
- 0 E Lassen Ave
- 2864 Upland Dr
- 2840 Upland Dr
- 2876 Upland Dr
- 2828 Upland Dr
- 2888 Upland Dr
- 2839 Upland Dr
- 2827 Upland Dr
- 0 Pauletah Place
- 1187 Deschutes Dr
- 2851 Upland Dr
- 1185 Deschutes Dr
- 55 Pauletah Place
- 22 Pauletah Place
- 2898 Upland Dr
- 2875 Upland Dr
- 61 Pauletah Place
- 1183 Deschutes Dr
- 1205 Whitewood Way
- 59 Pauletah Place
- 2842 Lovell Ave
Your Personal Tour Guide
Ask me questions while you tour the home.