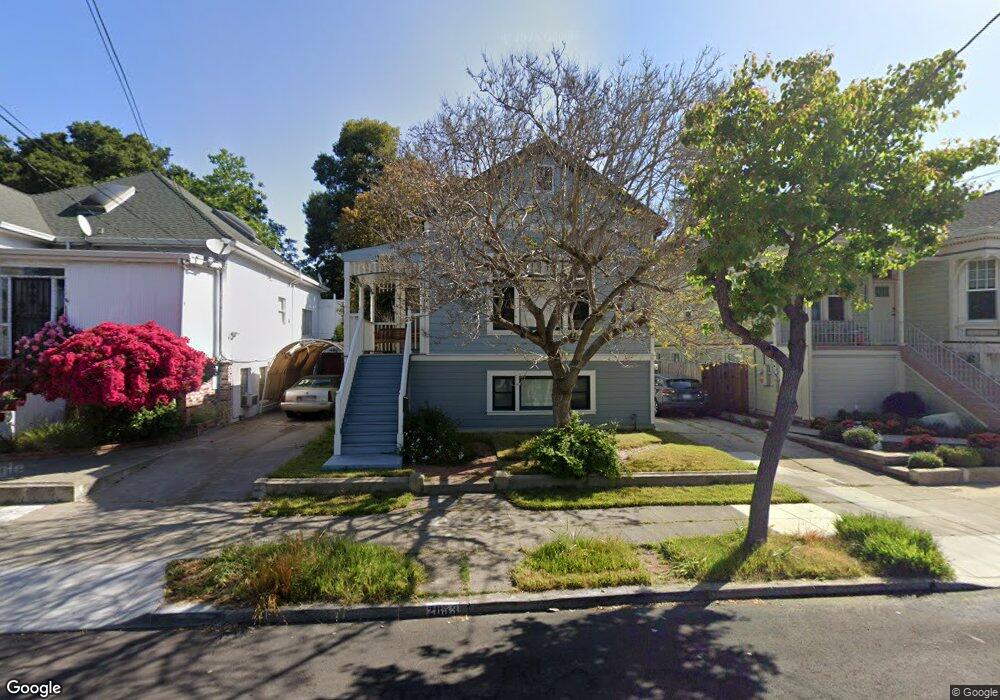
2853 Jackson St Alameda, CA 94501
Downtown Alameda NeighborhoodEstimated Value: $1,098,000 - $1,714,878
4
Beds
3
Baths
2,608
Sq Ft
$506/Sq Ft
Est. Value
About This Home
This home is located at 2853 Jackson St, Alameda, CA 94501 and is currently estimated at $1,319,970, approximately $506 per square foot. 2853 Jackson St is a home located in Alameda County with nearby schools including Frank Otis Elementary School, Lincoln Middle School, and Alameda High School.
Ownership History
Date
Name
Owned For
Owner Type
Purchase Details
Closed on
Oct 21, 1997
Sold by
Stocker Keith J and Stocker Janet H
Bought by
Rizzo James P and Brault Kathryn M
Current Estimated Value
Home Financials for this Owner
Home Financials are based on the most recent Mortgage that was taken out on this home.
Original Mortgage
$188,000
Outstanding Balance
$30,310
Interest Rate
7.49%
Estimated Equity
$1,289,660
Create a Home Valuation Report for This Property
The Home Valuation Report is an in-depth analysis detailing your home's value as well as a comparison with similar homes in the area
Home Values in the Area
Average Home Value in this Area
Purchase History
| Date | Buyer | Sale Price | Title Company |
|---|---|---|---|
| Rizzo James P | $235,000 | North American Title Co |
Source: Public Records
Mortgage History
| Date | Status | Borrower | Loan Amount |
|---|---|---|---|
| Open | Rizzo James P | $188,000 |
Source: Public Records
Tax History
| Year | Tax Paid | Tax Assessment Tax Assessment Total Assessment is a certain percentage of the fair market value that is determined by local assessors to be the total taxable value of land and additions on the property. | Land | Improvement |
|---|---|---|---|---|
| 2025 | $9,867 | $601,999 | $112,565 | $496,434 |
| 2024 | $9,867 | $590,061 | $110,358 | $486,703 |
| 2023 | $9,526 | $585,354 | $108,194 | $477,160 |
| 2022 | $9,331 | $566,878 | $106,073 | $467,805 |
| 2021 | $7,809 | $514,645 | $103,993 | $417,652 |
| 2020 | $5,705 | $343,092 | $102,927 | $240,165 |
| 2019 | $5,289 | $336,367 | $100,910 | $235,457 |
| 2018 | $5,163 | $329,772 | $98,931 | $230,841 |
| 2017 | $4,947 | $323,307 | $96,992 | $226,315 |
| 2016 | $4,939 | $316,970 | $95,091 | $221,879 |
| 2015 | $4,918 | $312,208 | $93,662 | $218,546 |
| 2014 | $4,715 | $306,094 | $91,828 | $214,266 |
Source: Public Records
Map
Nearby Homes
- 1308 Court St
- 2608 Central Ave
- 3248 Briggs Ave
- 1601 Broadway Unit 9
- 2417 Marti Rae Ct
- 1241 Park Ave
- 1251 Park St
- 2312 San Antonio Ave
- 1100 Park Ave
- 976 Park St
- 954 Park St
- 2932 Marina Dr
- 2214 Clinton Ave
- 2200 San Jose Ave
- 405 Centre Ct
- 608 Centre Ct
- 2959 Sea View Pkwy
- 641 Centre Ct
- 2853 Regatta Dr Unit 179
- 2137 Otis Dr Unit 111
- 2855 Jackson St
- 2851 Jackson St
- 2857 Jackson St
- 2849 Jackson St
- 1349 Mound St
- 2852 Van Buren St
- 2847 Jackson St
- 1351 Mound St
- 2856 Van Buren St
- 2846 Van Buren St
- 2860 Van Buren St
- 2854 Jackson St
- 2852 Jackson St
- 2856 Jackson St
- 2864 Van Buren St
- 2860 Jackson St
- 1342 Grove St
- 1338 Grove St
- 1332 Mound St
- 1334 Grove St
Your Personal Tour Guide
Ask me questions while you tour the home.