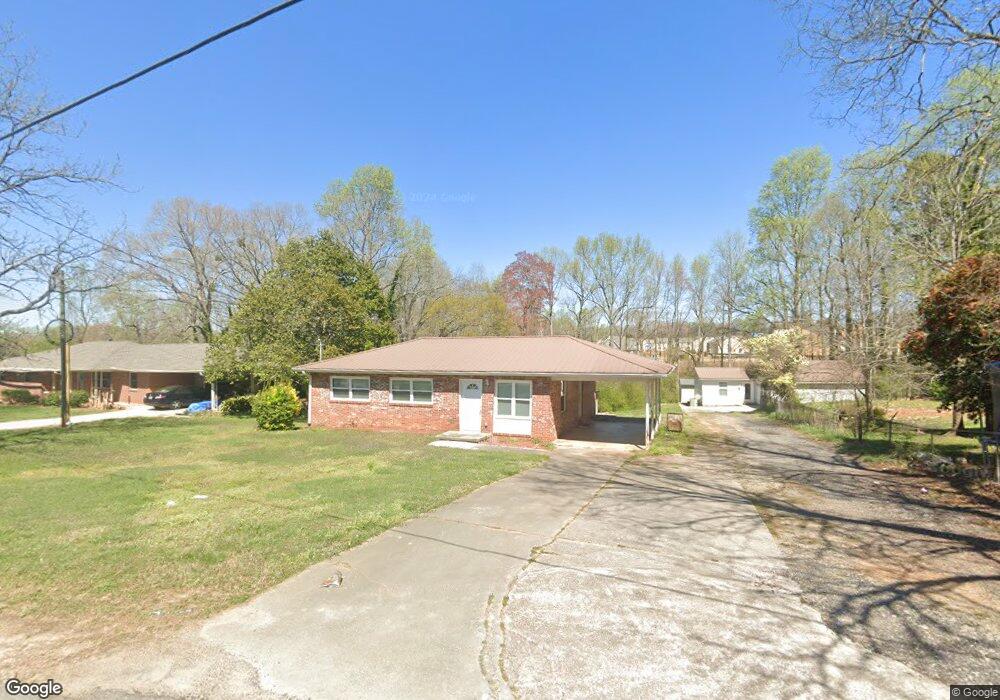
2854 Pinecrest Dr Gainesville, GA 30504
West Side NeighborhoodEstimated Value: $221,000 - $285,000
3
Beds
1
Bath
950
Sq Ft
$268/Sq Ft
Est. Value
About This Home
This home is located at 2854 Pinecrest Dr, Gainesville, GA 30504 and is currently estimated at $254,453, approximately $267 per square foot. 2854 Pinecrest Dr is a home located in Hall County with nearby schools including Chicopee Elementary School, West Hall Middle School, and West Hall High School.
Ownership History
Date
Name
Owned For
Owner Type
Purchase Details
Closed on
Nov 23, 2021
Sold by
Villatoro Isis S
Bought by
Southard James W
Current Estimated Value
Home Financials for this Owner
Home Financials are based on the most recent Mortgage that was taken out on this home.
Original Mortgage
$160,000
Outstanding Balance
$145,643
Interest Rate
3.14%
Mortgage Type
New Conventional
Estimated Equity
$108,810
Purchase Details
Closed on
Apr 23, 2020
Sold by
Villatoro Cesar Augusto
Bought by
Villatoro Isis S
Purchase Details
Closed on
Oct 12, 2018
Sold by
Timmons Ralph U
Bought by
Villatoro Cesar Augusto
Home Financials for this Owner
Home Financials are based on the most recent Mortgage that was taken out on this home.
Original Mortgage
$80,000
Interest Rate
4.6%
Mortgage Type
New Conventional
Purchase Details
Closed on
Oct 21, 2013
Sold by
Davis Phil
Bought by
Timmons Ralph U and Timmons Eleanor M
Purchase Details
Closed on
Nov 21, 1986
Sold by
Davis Phil
Bought by
Davis Annie Pauline Cannon
Create a Home Valuation Report for This Property
The Home Valuation Report is an in-depth analysis detailing your home's value as well as a comparison with similar homes in the area
Home Values in the Area
Average Home Value in this Area
Purchase History
| Date | Buyer | Sale Price | Title Company |
|---|---|---|---|
| Southard James W | $200,000 | -- | |
| Villatoro Isis S | -- | -- | |
| Villatoro Cesar Augusto | $75,000 | -- | |
| Villatoro Cesar Augusto | $100,000 | -- | |
| Timmons Ralph U | $106,000 | -- | |
| Davis Annie Pauline Cannon | -- | -- |
Source: Public Records
Mortgage History
| Date | Status | Borrower | Loan Amount |
|---|---|---|---|
| Open | Southard James W | $160,000 | |
| Previous Owner | Villatoro Cesar Augusto | $80,000 |
Source: Public Records
Tax History
| Year | Tax Paid | Tax Assessment Tax Assessment Total Assessment is a certain percentage of the fair market value that is determined by local assessors to be the total taxable value of land and additions on the property. | Land | Improvement |
|---|---|---|---|---|
| 2025 | $2,570 | $104,760 | $15,800 | $88,960 |
| 2024 | $2,442 | $95,960 | $10,560 | $85,400 |
| 2023 | $2,337 | $87,960 | $10,120 | $77,840 |
| 2022 | $1,860 | $69,400 | $10,120 | $59,280 |
| 2021 | $1,284 | $46,120 | $7,360 | $38,760 |
| 2020 | $1,199 | $41,640 | $7,360 | $34,280 |
| 2019 | $1,101 | $37,680 | $8,840 | $28,840 |
| 2018 | $597 | $18,560 | $9,200 | $9,360 |
| 2017 | $572 | $17,840 | $9,200 | $8,640 |
| 2016 | $452 | $13,880 | $6,160 | $7,720 |
| 2015 | $485 | $13,880 | $6,160 | $7,720 |
| 2014 | $485 | $14,952 | $6,160 | $8,792 |
Source: Public Records
Map
Nearby Homes
- 2856 Pinecrest Dr
- 2346 4th St
- 2147 Luna Ln
- 5300 Magnolia Place Unit 186
- 5288 Magnolia Place
- 5287 Magonlia Grove Way Unit 179
- 5288 Magnolia Place Unit 189
- 5308 Magnolia Place Unit 184
- 4219 Box Elder Path
- 19 Fourth St
- 25 Fourth St
- 4245 Pearhaven Ln SW
- 4405 Chestnut Oak Way SW
- 4417 Chestnut Oak Way SW
- 4613 Water Oak Ct SW
- 4615 Silver Oak Dr SW
- 4489 Mill Oak Way SW
- 4644 Brayden Dr
- 5303 Magnolia Grove Way Unit 183
- 5303 Magnolia Grove Way
- 2854 Pinecrest Dr
- 2854 Pinecrest Dr
- 2854 Pinecrest Dr
- 2848 Pinecrest Dr
- 2860 Pinecrest Dr
- 2863 Pinecrest Dr
- 2844 Pinecrest Dr
- 2843 Pinecrest Dr
- 2840 Pinecrest Dr
- 2864 Pinecrest Dr
- 2834 Pinecrest Dr
- 2835 Pinecrest Dr
- 2865 Pinecrest Dr
- 2828 Pinecrest Dr
- 2866 Pinecrest Dr
- 2410 Peak Ridge Ln
- 3611 Titshaw Dr
- 2822 Pinecrest Dr
- 3607 Titshaw Dr
- 2422 Peak Ridge Ln
Your Personal Tour Guide
Ask me questions while you tour the home.