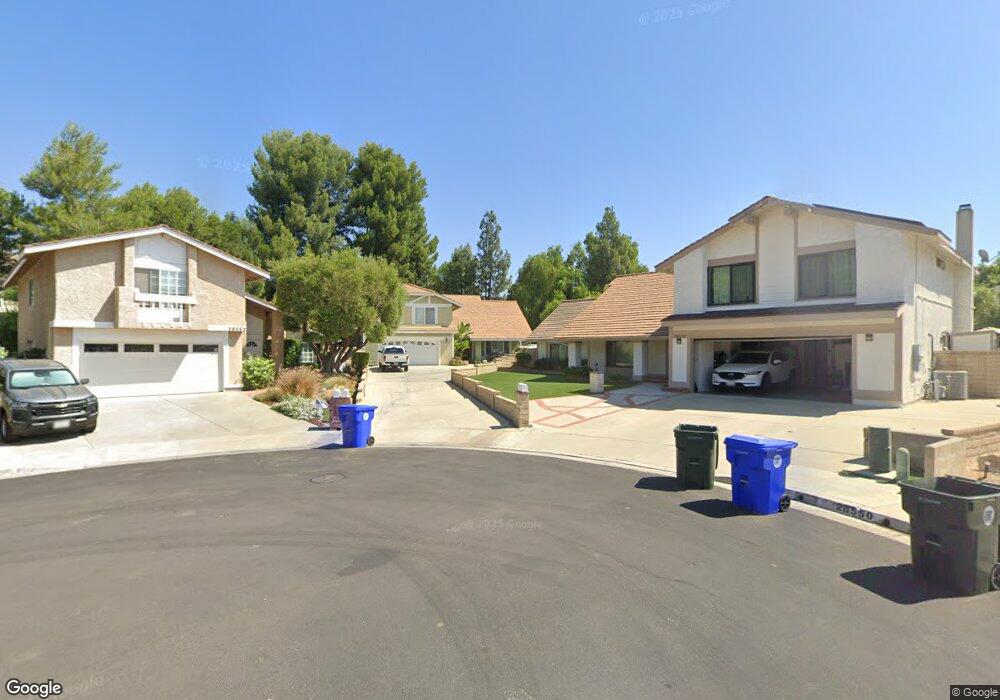
28557 Bud Ct Santa Clarita, CA 91350
Saugus NeighborhoodEstimated Value: $882,000 - $928,000
4
Beds
3
Baths
2,322
Sq Ft
$392/Sq Ft
Est. Value
About This Home
This home is located at 28557 Bud Ct, Santa Clarita, CA 91350 and is currently estimated at $909,194, approximately $391 per square foot. 28557 Bud Ct is a home located in Los Angeles County with nearby schools including Rosedell Elementary School, Arroyo Seco Junior High School, and Saugus High School.
Ownership History
Date
Name
Owned For
Owner Type
Purchase Details
Closed on
Oct 10, 2017
Sold by
Quashen Cary Ian and Quashen Kirsten Lynn
Bought by
Quashen Kirsten Lynn
Current Estimated Value
Purchase Details
Closed on
Nov 2, 2006
Sold by
Quashen Cary Ian and Quashen Kirsten Lynn
Bought by
Quashen Cary Ian and Quashen Kirsten Lynn
Purchase Details
Closed on
Jan 10, 1998
Sold by
Purvis Jack R
Bought by
Purvis Carroll E
Home Financials for this Owner
Home Financials are based on the most recent Mortgage that was taken out on this home.
Original Mortgage
$200,000
Outstanding Balance
$33,567
Interest Rate
7.14%
Estimated Equity
$875,627
Purchase Details
Closed on
Dec 11, 1997
Sold by
Purvis Carroll E
Bought by
Quashen Cary I and Quashen Kirsten L
Home Financials for this Owner
Home Financials are based on the most recent Mortgage that was taken out on this home.
Original Mortgage
$200,000
Outstanding Balance
$33,567
Interest Rate
7.14%
Estimated Equity
$875,627
Create a Home Valuation Report for This Property
The Home Valuation Report is an in-depth analysis detailing your home's value as well as a comparison with similar homes in the area
Home Values in the Area
Average Home Value in this Area
Purchase History
| Date | Buyer | Sale Price | Title Company |
|---|---|---|---|
| Quashen Kirsten Lynn | -- | None Available | |
| Quashen Cary Ian | -- | None Available | |
| Purvis Carroll E | -- | First American | |
| Quashen Cary I | $253,000 | First American |
Source: Public Records
Mortgage History
| Date | Status | Borrower | Loan Amount |
|---|---|---|---|
| Open | Quashen Cary I | $200,000 |
Source: Public Records
Tax History Compared to Growth
Tax History
| Year | Tax Paid | Tax Assessment Tax Assessment Total Assessment is a certain percentage of the fair market value that is determined by local assessors to be the total taxable value of land and additions on the property. | Land | Improvement |
|---|---|---|---|---|
| 2025 | $5,977 | $403,958 | $132,359 | $271,599 |
| 2024 | $5,977 | $396,038 | $129,764 | $266,274 |
| 2023 | $5,714 | $388,273 | $127,220 | $261,053 |
| 2022 | $5,734 | $380,661 | $124,726 | $255,935 |
| 2021 | $5,633 | $373,198 | $122,281 | $250,917 |
| 2019 | $5,437 | $362,131 | $118,655 | $243,476 |
| 2018 | $5,212 | $355,031 | $116,329 | $238,702 |
| 2017 | $5,111 | $348,071 | $114,049 | $234,022 |
| 2016 | $4,913 | $341,247 | $111,813 | $229,434 |
| 2015 | $4,732 | $336,122 | $110,134 | $225,988 |
| 2014 | $4,664 | $329,539 | $107,977 | $221,562 |
Source: Public Records
Map
Nearby Homes
- 20643 Calhaven Dr
- 28647 Visco Ct
- 28723 Park Woodland Place
- 28741 Park Woodland Place
- 20818 Benz Rd
- 28811 Park Woodland Place
- 28760 Mauch St
- 20623 Russ Jay St
- 21103 Cross Creek Dr
- 20055 Oakside Ct
- 28144 Alaminos Dr
- 21163 Lone Star Way
- 20715 Dot St
- 21240 Lone Star Way
- 28652 Deer Springs Dr
- 28016 Robin Ave
- 0 Shadow Valley Ln Unit 225000929
- 0 Shadow Valley Ln Unit 25533363
- 20558 Romar Ln
- 29021 Bouquet Canyon Rd Unit 317
- 28553 Bud Ct
- 28541 Kathleen Ave
- 28547 Kathleen Ave
- 28552 Bud Ct
- 28535 Kathleen Ave
- 28549 Bud Ct
- 28527 Kathleen Ave
- 28550 Bud Ct
- 28545 Bud Ct
- 20538 Calhaven Dr
- 20546 Calhaven Dr
- 20532 Calhaven Dr
- 28521 Kathleen Ave
- 20602 Calhaven Dr
- 28548 Bud Ct
- 20526 Calhaven Dr
- 28546 Kathleen Ave
- 28538 Kathleen Ave
- 28542 Bud Ct
- 28539 Bud Ct