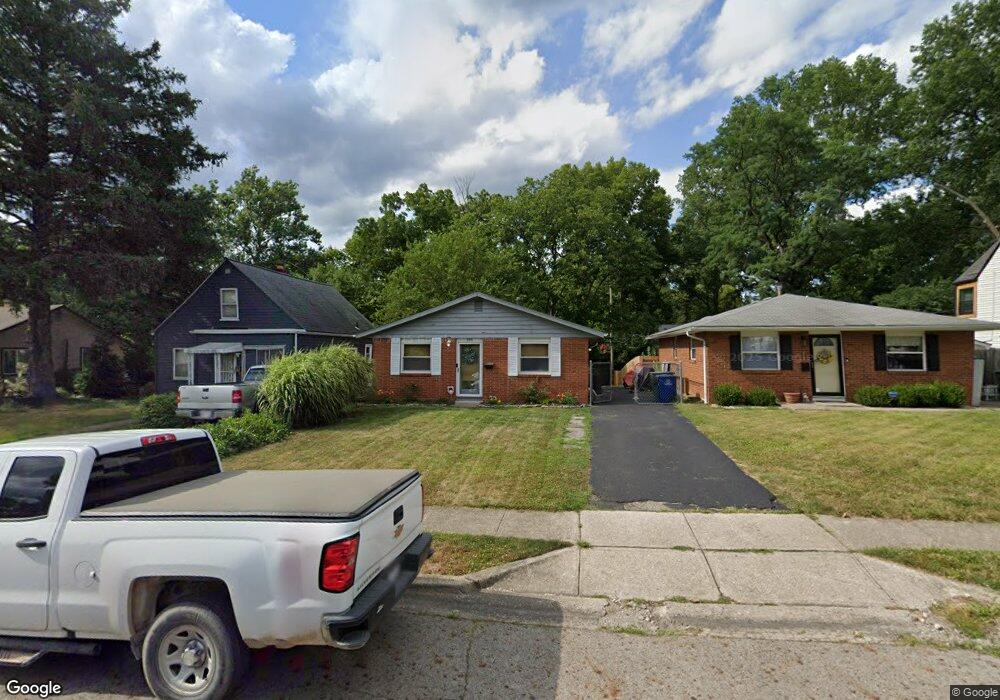
286 Chase Rd Columbus, OH 43214
Clintonville NeighborhoodEstimated Value: $280,000 - $336,000
3
Beds
2
Baths
999
Sq Ft
$303/Sq Ft
Est. Value
About This Home
This home is located at 286 Chase Rd, Columbus, OH 43214 and is currently estimated at $303,062, approximately $303 per square foot. 286 Chase Rd is a home located in Franklin County with nearby schools including Salem Elementary School, Dominion Middle School, and Whetstone High School.
Ownership History
Date
Name
Owned For
Owner Type
Purchase Details
Closed on
May 13, 2020
Sold by
Watts Julie A and Watts Robert
Bought by
Watts Lindsey and Smithson James
Current Estimated Value
Home Financials for this Owner
Home Financials are based on the most recent Mortgage that was taken out on this home.
Original Mortgage
$156,868
Outstanding Balance
$137,505
Interest Rate
3.2%
Mortgage Type
New Conventional
Estimated Equity
$165,557
Purchase Details
Closed on
Jan 13, 2006
Sold by
Mcbride Lisa J
Bought by
Mcbride Charles F and Mcbride Darlene
Purchase Details
Closed on
Aug 15, 1995
Sold by
Ponticello Giles T
Bought by
Charles F Mcbride
Home Financials for this Owner
Home Financials are based on the most recent Mortgage that was taken out on this home.
Original Mortgage
$62,000
Interest Rate
7.51%
Mortgage Type
New Conventional
Purchase Details
Closed on
May 1, 1987
Purchase Details
Closed on
Feb 1, 1986
Create a Home Valuation Report for This Property
The Home Valuation Report is an in-depth analysis detailing your home's value as well as a comparison with similar homes in the area
Home Values in the Area
Average Home Value in this Area
Purchase History
| Date | Buyer | Sale Price | Title Company |
|---|---|---|---|
| Watts Lindsey | $162,000 | None Available | |
| Mcbride Charles F | -- | None Available | |
| Charles F Mcbride | $77,550 | -- | |
| -- | $59,000 | -- | |
| -- | -- | -- |
Source: Public Records
Mortgage History
| Date | Status | Borrower | Loan Amount |
|---|---|---|---|
| Open | Watts Lindsey | $156,868 | |
| Previous Owner | Charles F Mcbride | $62,000 |
Source: Public Records
Tax History
| Year | Tax Paid | Tax Assessment Tax Assessment Total Assessment is a certain percentage of the fair market value that is determined by local assessors to be the total taxable value of land and additions on the property. | Land | Improvement |
|---|---|---|---|---|
| 2025 | $4,020 | $89,570 | $33,710 | $55,860 |
| 2024 | $4,020 | $89,570 | $33,710 | $55,860 |
| 2023 | $3,969 | $89,565 | $33,705 | $55,860 |
| 2022 | $2,932 | $56,530 | $15,020 | $41,510 |
| 2021 | $2,937 | $56,530 | $15,020 | $41,510 |
| 2020 | $3,014 | $56,530 | $15,020 | $41,510 |
| 2019 | $3,199 | $51,450 | $11,550 | $39,900 |
| 2018 | $2,987 | $51,450 | $11,550 | $39,900 |
| 2017 | $3,050 | $51,450 | $11,550 | $39,900 |
| 2016 | $3,054 | $44,950 | $13,270 | $31,680 |
| 2015 | $2,780 | $44,950 | $13,270 | $31,680 |
| 2014 | $2,787 | $44,950 | $13,270 | $31,680 |
| 2013 | $1,309 | $42,805 | $12,635 | $30,170 |
Source: Public Records
Map
Nearby Homes
- 281 E Selby Blvd
- 119 E Lincoln Ave
- 468 E Lincoln Ave
- 5795 Foster Ave
- 587 Kenbrook Dr
- 627 S Selby Blvd
- 5790 Crescent Ct
- 5301 Indianola Ave
- 68 W Kanawha Ave
- 131 Broad Meadows Blvd
- 734 Worthington Forest Place Unit 734
- 736 Worthington Forest Place Unit 736
- 5364 Stock Rd
- 686 Plymouth St
- 5822 Falmouth Ct
- 649 High St Unit 202
- 252 W Kanawha Ave
- 177 Franklin Ave
- 952 Minerva Ave
- 268 E Stafford Ave
Your Personal Tour Guide
Ask me questions while you tour the home.