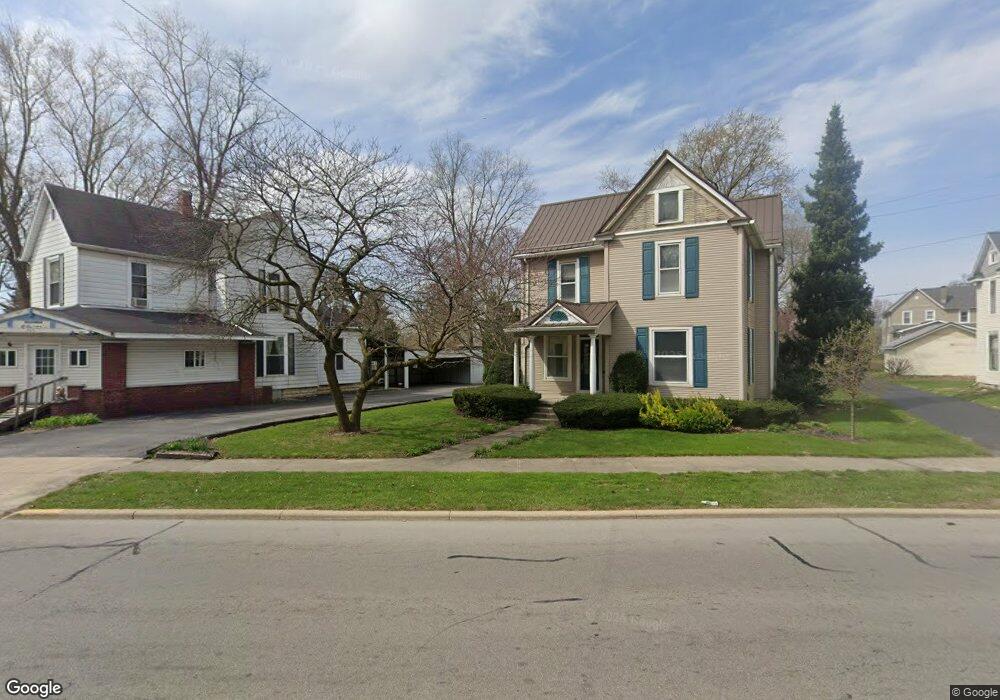
286 N Cass St Wabash, IN 46992
Estimated Value: $175,000 - $229,000
4
Beds
1
Bath
1,882
Sq Ft
$104/Sq Ft
Est. Value
About This Home
This home is located at 286 N Cass St, Wabash, IN 46992 and is currently estimated at $196,295, approximately $104 per square foot. 286 N Cass St is a home located in Wabash County with nearby schools including O.J. Neighbours Elementary School, W C Mills Elementary School, and Wabash Middle School.
Ownership History
Date
Name
Owned For
Owner Type
Purchase Details
Closed on
Mar 30, 2021
Sold by
Titus Randal J
Bought by
Titus Randal J and Titus Kimberly
Current Estimated Value
Purchase Details
Closed on
Jun 3, 2016
Sold by
Unknown Unknown and Titus Randal J
Bought by
Titus Randal J and Titus Kimberly
Home Financials for this Owner
Home Financials are based on the most recent Mortgage that was taken out on this home.
Original Mortgage
$60,000
Interest Rate
3.57%
Mortgage Type
Purchase Money Mortgage
Create a Home Valuation Report for This Property
The Home Valuation Report is an in-depth analysis detailing your home's value as well as a comparison with similar homes in the area
Home Values in the Area
Average Home Value in this Area
Purchase History
| Date | Buyer | Sale Price | Title Company |
|---|---|---|---|
| Titus Randal J | -- | None Available | |
| Titus Randal J | -- | None Available |
Source: Public Records
Mortgage History
| Date | Status | Borrower | Loan Amount |
|---|---|---|---|
| Closed | Titus Randal J | $60,000 |
Source: Public Records
Tax History Compared to Growth
Tax History
| Year | Tax Paid | Tax Assessment Tax Assessment Total Assessment is a certain percentage of the fair market value that is determined by local assessors to be the total taxable value of land and additions on the property. | Land | Improvement |
|---|---|---|---|---|
| 2024 | $1,556 | $155,600 | $15,800 | $139,800 |
| 2023 | $1,535 | $153,500 | $15,800 | $137,700 |
| 2022 | $1,395 | $139,500 | $15,800 | $123,700 |
| 2021 | $1,196 | $119,600 | $11,800 | $107,800 |
| 2020 | $1,116 | $111,600 | $11,800 | $99,800 |
| 2019 | $1,116 | $111,600 | $11,800 | $99,800 |
| 2018 | $1,082 | $108,200 | $11,800 | $96,400 |
| 2017 | $1,054 | $103,000 | $11,800 | $91,200 |
| 2016 | $681 | $102,800 | $11,800 | $91,000 |
| 2014 | $581 | $102,000 | $11,800 | $90,200 |
| 2013 | $457 | $100,100 | $11,800 | $88,300 |
Source: Public Records
Map
Nearby Homes
- 153 Ferry St
- 334 Ferry St
- 244 N Miami St
- 102 Stitt St
- 387 N Wabash St
- 492 W Maple St
- 495 Stitt St
- 125 N Comstock St
- 27 N Comstock St
- 35 E Sinclair St
- 425 N Huntington St
- 516 W Hill St
- 472 Vermont St
- 41 Noble St
- 747 N Spring St
- 459 E Hill St
- 739 Congress St
- 495 Manchester Ave
- 8 Creekside Ln
- 23 Deer Ln