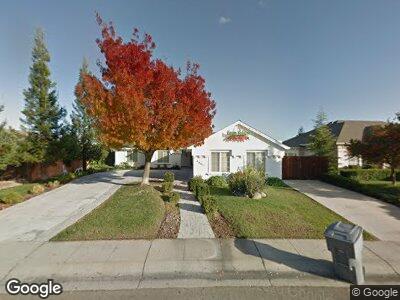
2861 Aspen Glow Ln Redding, CA 96001
Ridgeview NeighborhoodEstimated Value: $438,504 - $483,000
4
Beds
2
Baths
1,850
Sq Ft
$251/Sq Ft
Est. Value
About This Home
This home is located at 2861 Aspen Glow Ln, Redding, CA 96001 and is currently estimated at $464,876, approximately $251 per square foot. 2861 Aspen Glow Ln is a home located in Shasta County with nearby schools including Cypress Elementary School, Sequoia Middle School, and Shasta High School.
Ownership History
Date
Name
Owned For
Owner Type
Purchase Details
Closed on
Nov 1, 2019
Sold by
Moore David
Bought by
Moore David Michael and Moore Mary Lou
Current Estimated Value
Purchase Details
Closed on
Apr 3, 2000
Sold by
Russell Ryan C and Russell Catherine A
Bought by
Moore David
Home Financials for this Owner
Home Financials are based on the most recent Mortgage that was taken out on this home.
Original Mortgage
$130,000
Interest Rate
8.26%
Purchase Details
Closed on
Jan 13, 1999
Sold by
Signature Northwest Partnership
Bought by
Russell Ryan C and Russell Catherine A
Home Financials for this Owner
Home Financials are based on the most recent Mortgage that was taken out on this home.
Original Mortgage
$175,750
Interest Rate
6.66%
Create a Home Valuation Report for This Property
The Home Valuation Report is an in-depth analysis detailing your home's value as well as a comparison with similar homes in the area
Home Values in the Area
Average Home Value in this Area
Purchase History
| Date | Buyer | Sale Price | Title Company |
|---|---|---|---|
| Moore David Michael | -- | None Available | |
| Moore David | $184,000 | Chicago Title Co | |
| Russell Ryan C | $185,000 | Placer Title Company |
Source: Public Records
Mortgage History
| Date | Status | Borrower | Loan Amount |
|---|---|---|---|
| Open | Moore David | $190,000 | |
| Closed | Moore David | $185,000 | |
| Closed | Moore David | $12,885 | |
| Closed | Moore David | $31,630 | |
| Closed | Moore David | $170,000 | |
| Closed | Moore David | $23,307 | |
| Closed | Moore David | $172,000 | |
| Closed | Moore David | $21,469 | |
| Closed | Moore David | $150,000 | |
| Closed | Moore David | $130,000 | |
| Previous Owner | Russell Ryan C | $175,750 |
Source: Public Records
Tax History Compared to Growth
Tax History
| Year | Tax Paid | Tax Assessment Tax Assessment Total Assessment is a certain percentage of the fair market value that is determined by local assessors to be the total taxable value of land and additions on the property. | Land | Improvement |
|---|---|---|---|---|
| 2024 | $3,100 | $305,112 | $52,726 | $252,386 |
| 2023 | $3,100 | $299,131 | $51,693 | $247,438 |
| 2022 | $3,047 | $293,267 | $50,680 | $242,587 |
| 2021 | $3,031 | $287,518 | $49,687 | $237,831 |
| 2020 | $3,071 | $284,571 | $49,178 | $235,393 |
| 2019 | $2,913 | $278,992 | $48,214 | $230,778 |
| 2018 | $2,939 | $273,522 | $47,269 | $226,253 |
| 2017 | $2,922 | $268,160 | $46,343 | $221,817 |
| 2016 | $3,036 | $262,903 | $45,435 | $217,468 |
| 2015 | $2,998 | $258,955 | $44,753 | $214,202 |
| 2014 | $2,975 | $253,884 | $43,877 | $210,007 |
Source: Public Records
Map
Nearby Homes
- 2965 Shadow Brook Ln
- 3559 Auburn Dr
- 2771 Dawnridge Dr
- 4330 Rising Mist Cir
- 3525 Elizabeth Way
- 4368 Wild Flower Way
- 2995 Howard Dr
- 2234 Everest Dr
- 3456 Summit Dr
- 3845 Sunglow Dr
- 3680 Wasatch Dr
- 1830 Wasatch Ct
- 1085 Riviera Dr
- 1208 Riviera Dr
- 2900 Puma Trail
- 3714 Fujiyama Way
- 4375 Sounding Brook Ct
- 3994 Sea Lavender Ct
- 16946 Campo Calle
- 3859 Sea Lavender Ct
- 2861 Aspen Glow Ln
- 2861 Aspen Grow
- 2869 Aspen Glow Ln
- 2853 Aspen Glow Ln
- 2877 Aspen Glow Ln
- 2845 Aspen Glow Ln
- 3051 Blue Bell Dr
- 2858 Aspen Glow Ln
- 3051 Blue Bell Dr#38 Unit 14
- 3067 Blue Bell Dr
- 2866 Aspen Glow Ln
- 2837 Aspen Glow Ln
- 2850 Aspen Glow Ln
- 2885 Aspen Glow Ln
- 3035 Blue Bell Dr
- 2874 Aspen Glow Ln
- 3083 Blue Bell Dr
- 2842 Aspen Glow Ln
- 3019 Blue Bell Dr
- 2891 Aspen Glow Ln