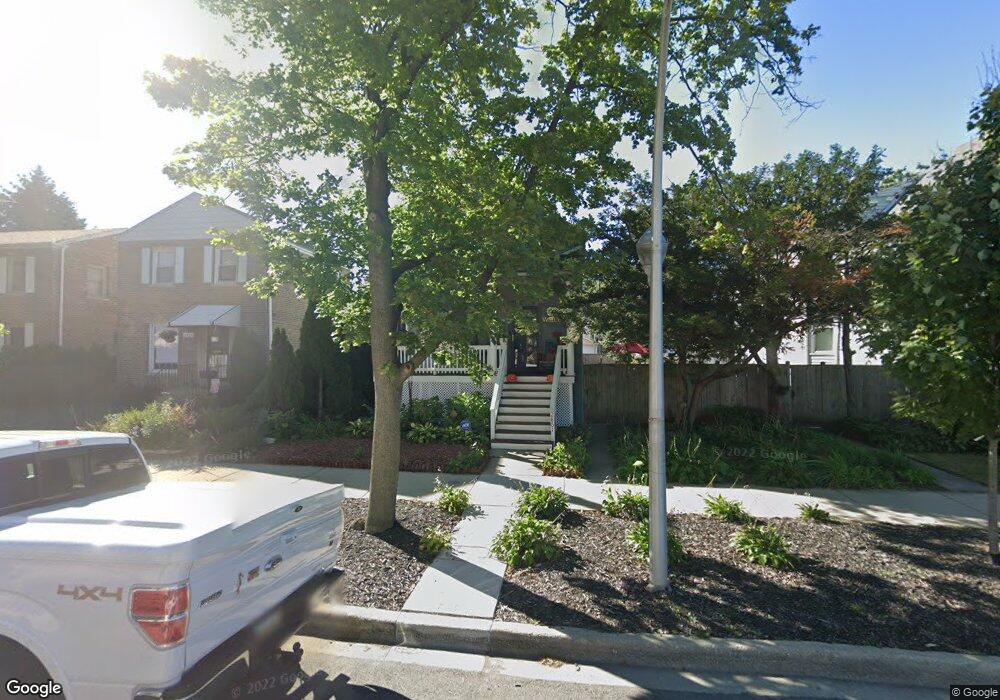
2861 W Roscoe St Chicago, IL 60618
Avondale NeighborhoodEstimated Value: $649,000 - $831,000
4
Beds
2
Baths
1,966
Sq Ft
$376/Sq Ft
Est. Value
About This Home
This home is located at 2861 W Roscoe St, Chicago, IL 60618 and is currently estimated at $739,817, approximately $376 per square foot. 2861 W Roscoe St is a home located in Cook County with nearby schools including Linne Elementary School, Schurz High School, and Acero Charter - Carlos Fuentes Cmpus.
Ownership History
Date
Name
Owned For
Owner Type
Purchase Details
Closed on
Jun 11, 2020
Sold by
Smith Jason D
Bought by
Smith Jason D and Smith Bridget E
Current Estimated Value
Purchase Details
Closed on
May 10, 2011
Sold by
Voss Joseph M
Bought by
Smith Jason D
Home Financials for this Owner
Home Financials are based on the most recent Mortgage that was taken out on this home.
Original Mortgage
$282,794
Outstanding Balance
$197,251
Interest Rate
4.96%
Mortgage Type
FHA
Estimated Equity
$542,566
Purchase Details
Closed on
May 20, 1999
Sold by
Payne Richard R and Payne Susan Mason
Bought by
Voss Joseph M
Home Financials for this Owner
Home Financials are based on the most recent Mortgage that was taken out on this home.
Original Mortgage
$144,000
Interest Rate
7.43%
Mortgage Type
Purchase Money Mortgage
Create a Home Valuation Report for This Property
The Home Valuation Report is an in-depth analysis detailing your home's value as well as a comparison with similar homes in the area
Home Values in the Area
Average Home Value in this Area
Purchase History
| Date | Buyer | Sale Price | Title Company |
|---|---|---|---|
| Smith Jason D | -- | Attorney | |
| Smith Jason D | $240,000 | Stewart Title Company | |
| Voss Joseph M | $180,000 | -- |
Source: Public Records
Mortgage History
| Date | Status | Borrower | Loan Amount |
|---|---|---|---|
| Open | Smith Jason D | $282,794 | |
| Previous Owner | Voss Joseph M | $144,000 |
Source: Public Records
Tax History Compared to Growth
Tax History
| Year | Tax Paid | Tax Assessment Tax Assessment Total Assessment is a certain percentage of the fair market value that is determined by local assessors to be the total taxable value of land and additions on the property. | Land | Improvement |
|---|---|---|---|---|
| 2024 | $8,614 | $62,000 | $29,059 | $32,941 |
| 2023 | $8,375 | $44,000 | $22,175 | $21,825 |
| 2022 | $8,375 | $44,000 | $22,175 | $21,825 |
| 2021 | $8,205 | $43,998 | $22,174 | $21,824 |
| 2020 | $9,033 | $43,505 | $10,311 | $33,194 |
| 2019 | $9,056 | $48,339 | $10,311 | $38,028 |
| 2018 | $8,870 | $48,339 | $10,311 | $38,028 |
| 2017 | $7,020 | $32,612 | $9,374 | $23,238 |
| 2016 | $6,532 | $32,612 | $9,374 | $23,238 |
| 2015 | $6,907 | $37,690 | $9,374 | $28,316 |
| 2014 | $5,442 | $29,328 | $8,436 | $20,892 |
| 2013 | $5,334 | $29,328 | $8,436 | $20,892 |
Source: Public Records
Map
Nearby Homes
- 3215 N Francisco Ave Unit 3S
- 3215 N Elston Ave Unit 2S
- 3215 N Elston Ave Unit 2N
- 3342 N Whipple St
- 2732 W Belmont Ave
- 3523 N Whipple St
- 3035 W Belmont Ave Unit 3E
- 2844 W Addison St Unit P1
- 3100 N Albany Ave
- 3234 N Albany Ave
- 3621 N Richmond St
- 3140 N Elston Ave Unit 3N
- 3101 N California Ave Unit 3N
- 3122 W Belmont Ave
- 2623 W Belmont Ave Unit 3
- 2733 W Nelson St
- 3716 N Richmond St
- 3039 N Troy St Unit 2E
- 3042 N Troy St
- 2723 W Wellington Ave Unit 1
- 2859 W Roscoe St
- 2867 W Roscoe St
- 2855 W Roscoe St
- 2701 W Roscoe St
- 2849 W Roscoe St
- 2907 W Roscoe St
- 2860 W Henderson St
- 2845 W Roscoe St
- 2909 W Roscoe St
- 2856 W Henderson St
- 2858 W Henderson St
- 2858 W Henderson St Unit 1
- 2858 W Henderson St Unit Basement
- 2858 W Henderson St Unit 2
- 2858 W Henderson St Unit 1
- 2864 W Henderson St
- 2870 W Henderson St Unit 1
- 2870 W Henderson St
- 2866 W Henderson St
- 2852 W Henderson St