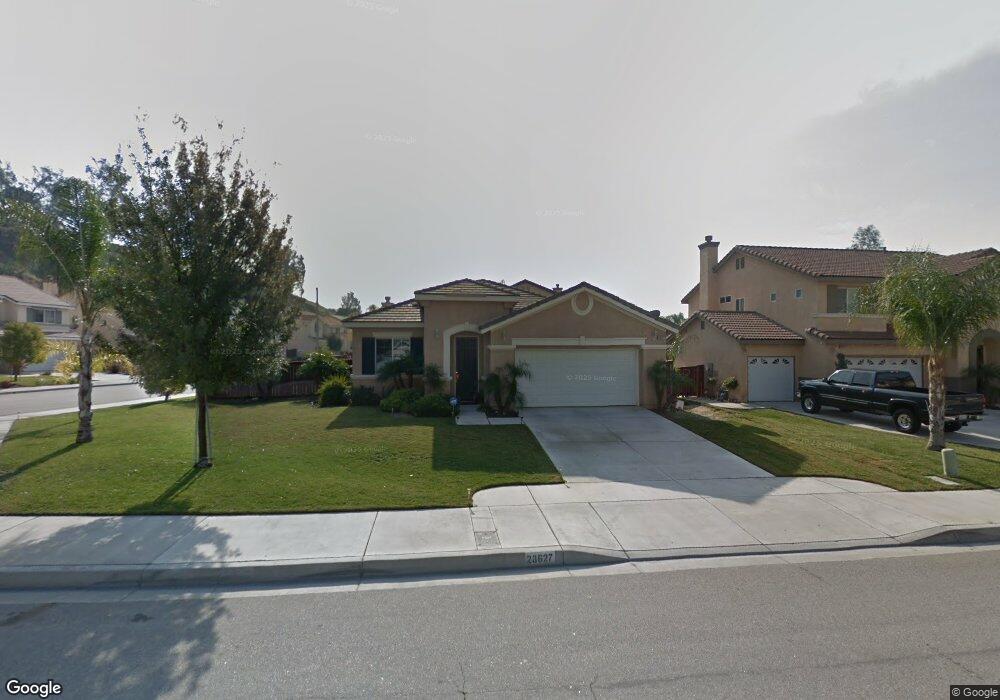
28627 Kristin Ln Highland, CA 92346
East Highlands NeighborhoodEstimated Value: $582,439 - $655,000
3
Beds
2
Baths
1,864
Sq Ft
$340/Sq Ft
Est. Value
About This Home
This home is located at 28627 Kristin Ln, Highland, CA 92346 and is currently estimated at $634,360, approximately $340 per square foot. 28627 Kristin Ln is a home located in San Bernardino County with nearby schools including Highland Grove Elementary School, Beattie Middle School, and Citrus Valley High School.
Ownership History
Date
Name
Owned For
Owner Type
Purchase Details
Closed on
Mar 25, 2019
Sold by
The Samuel J Riggio Living Trust
Bought by
Licon Mark A and Licon Rebecca S
Current Estimated Value
Home Financials for this Owner
Home Financials are based on the most recent Mortgage that was taken out on this home.
Original Mortgage
$296,250
Interest Rate
4%
Mortgage Type
New Conventional
Purchase Details
Closed on
Nov 26, 2018
Sold by
Riggio Samuel J and Riggio Sally L
Bought by
Riggio David S and Keel Linda P
Purchase Details
Closed on
Mar 26, 2002
Sold by
H & B Highland Llc
Bought by
Riggio Samuel J and Riggio Sally L
Home Financials for this Owner
Home Financials are based on the most recent Mortgage that was taken out on this home.
Original Mortgage
$143,000
Interest Rate
6.12%
Create a Home Valuation Report for This Property
The Home Valuation Report is an in-depth analysis detailing your home's value as well as a comparison with similar homes in the area
Home Values in the Area
Average Home Value in this Area
Purchase History
| Date | Buyer | Sale Price | Title Company |
|---|---|---|---|
| Licon Mark A | $395,000 | Western Resources Title Co | |
| Riggio David S | -- | None Available | |
| Riggio Samuel J | $223,500 | Lawyers Title Company |
Source: Public Records
Mortgage History
| Date | Status | Borrower | Loan Amount |
|---|---|---|---|
| Previous Owner | Licon Mark A | $296,250 | |
| Previous Owner | Riggio Samuel J | $143,000 |
Source: Public Records
Tax History Compared to Growth
Tax History
| Year | Tax Paid | Tax Assessment Tax Assessment Total Assessment is a certain percentage of the fair market value that is determined by local assessors to be the total taxable value of land and additions on the property. | Land | Improvement |
|---|---|---|---|---|
| 2025 | $5,768 | $440,629 | $132,188 | $308,441 |
| 2024 | $5,768 | $431,989 | $129,596 | $302,393 |
| 2023 | $5,747 | $423,519 | $127,055 | $296,464 |
| 2022 | $5,652 | $415,215 | $124,564 | $290,651 |
| 2021 | $5,695 | $407,074 | $122,122 | $284,952 |
| 2020 | $5,593 | $402,900 | $120,870 | $282,030 |
| 2019 | $4,045 | $290,182 | $58,425 | $231,757 |
| 2018 | $3,889 | $284,492 | $57,279 | $227,213 |
| 2017 | $3,646 | $278,914 | $56,156 | $222,758 |
| 2016 | $3,596 | $273,445 | $55,055 | $218,390 |
| 2015 | $3,560 | $269,338 | $54,228 | $215,110 |
| 2014 | $3,490 | $264,062 | $53,166 | $210,896 |
Source: Public Records
Map
Nearby Homes
- 7354 Harding Ct
- 7336 Harding Ct
- 7413 Crimson Dr
- 7524 Sunny Ridge Loop
- 0 Baseline St Unit CV25136921
- 7214 Quail Run Dr
- 7265 Fletcher View Dr
- 28544 Foxboro Ln
- 7816 Boxwood Ct
- 7126 Ridge Dr
- 7223 Yarnell Rd
- 7440 Apple Blossom Ct
- 7905 Valencia Ct
- 28405 Wild Rose Ln
- 28780 Beattie St
- 29058 Rosewood Ln
- 6828 6828 Tiara
- 4040 4040 E Piedmont Unit 277
- 3520 Aurora Dr E
- 3552 Aurora Dr E
- 28619 Kristin Ln
- 7470 Autumn Chase Dr
- 7457 Autumn Chase Dr
- 7461 Autumn Chase Dr
- 7482 Autumn Chase Dr
- 7443 Melanie Ct
- 7475 Autumn Chase Dr
- 28626 Kristin Ln
- 7441 Autumn Chase Dr
- 28636 Kristin Ln
- 28616 Kristin Ln
- 7465 Melanie Ct
- 7487 Autumn Chase Dr
- 7494 Autumn Chase Dr
- 28606 Kristin Ln
- 7495 Autumn Chase Dr
- 28598 Kristin Ln
- 7433 Autumn Chase Dr
- 7498 Autumn Chase Dr
- 7479 Melanie Ct