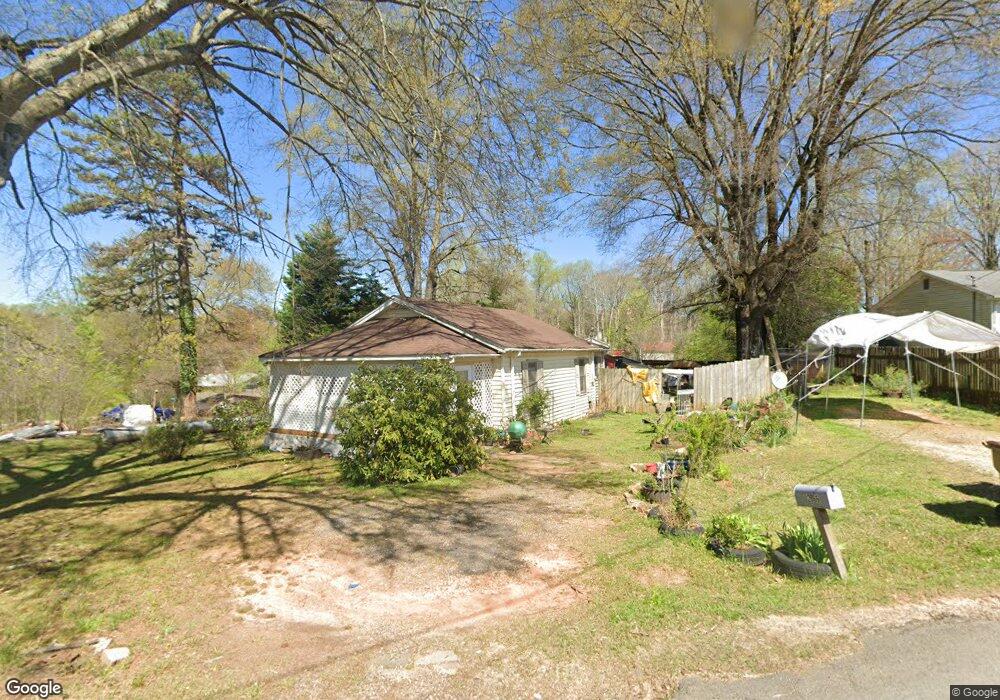
2866 Pinecrest Dr Gainesville, GA 30504
West Side NeighborhoodEstimated Value: $114,000 - $194,000
2
Beds
1
Bath
910
Sq Ft
$188/Sq Ft
Est. Value
About This Home
This home is located at 2866 Pinecrest Dr, Gainesville, GA 30504 and is currently estimated at $171,487, approximately $188 per square foot. 2866 Pinecrest Dr is a home located in Hall County with nearby schools including Chicopee Elementary School, West Hall Middle School, and West Hall High School.
Ownership History
Date
Name
Owned For
Owner Type
Purchase Details
Closed on
Mar 9, 2023
Sold by
Thorjt Lllp
Bought by
Thornton Properties And Rentals Llc
Current Estimated Value
Purchase Details
Closed on
Jun 15, 2018
Sold by
Thornton David
Bought by
Thorjt Lllp
Purchase Details
Closed on
Dec 13, 2010
Sold by
Homestar Mtg Acceptanc 2004 & 5
Bought by
Thornton David and Thornton Marion
Purchase Details
Closed on
Nov 2, 2010
Sold by
Casper Tony W
Bought by
Homestar Mtg Acceptanc 2004 & 5
Purchase Details
Closed on
Aug 9, 2004
Sold by
Casper Tony William
Bought by
Casper Tony W and Casper Vickie L
Home Financials for this Owner
Home Financials are based on the most recent Mortgage that was taken out on this home.
Original Mortgage
$80,000
Interest Rate
6.25%
Mortgage Type
Stand Alone Second
Purchase Details
Closed on
Jul 2, 1998
Sold by
Casper Vallieree
Bought by
Casper Tony William
Create a Home Valuation Report for This Property
The Home Valuation Report is an in-depth analysis detailing your home's value as well as a comparison with similar homes in the area
Home Values in the Area
Average Home Value in this Area
Purchase History
| Date | Buyer | Sale Price | Title Company |
|---|---|---|---|
| Thornton Properties And Rentals Llc | -- | -- | |
| Thorjt Lllp | -- | -- | |
| Thornton David | -- | -- | |
| Thornton David | $33,000 | -- | |
| Homestar Mtg Acceptanc 2004 & 5 | $27,000 | -- | |
| Casper Tony W | -- | -- | |
| Casper Tony William | -- | -- |
Source: Public Records
Mortgage History
| Date | Status | Borrower | Loan Amount |
|---|---|---|---|
| Previous Owner | Casper Tony W | $80,000 |
Source: Public Records
Tax History
| Year | Tax Paid | Tax Assessment Tax Assessment Total Assessment is a certain percentage of the fair market value that is determined by local assessors to be the total taxable value of land and additions on the property. | Land | Improvement |
|---|---|---|---|---|
| 2025 | $1,009 | $39,224 | $19,520 | $19,704 |
| 2024 | $988 | $37,024 | $17,400 | $19,624 |
| 2023 | $1,051 | $39,544 | $21,800 | $17,744 |
| 2022 | $997 | $35,864 | $21,800 | $14,064 |
| 2021 | $693 | $23,584 | $10,720 | $12,864 |
| 2020 | $676 | $22,264 | $10,720 | $11,544 |
| 2019 | $695 | $22,744 | $12,840 | $9,904 |
| 2018 | $545 | $16,709 | $12,040 | $4,669 |
| 2017 | $540 | $16,709 | $12,040 | $4,669 |
| 2016 | $474 | $14,669 | $10,000 | $4,669 |
| 2015 | $486 | $14,989 | $10,320 | $4,669 |
| 2014 | $486 | $14,989 | $10,320 | $4,669 |
Source: Public Records
Map
Nearby Homes
- 2856 Pinecrest Dr
- 2346 4th St
- 2147 Luna Ln
- 4219 Box Elder Path
- 5300 Magnolia Place Unit 186
- 5288 Magnolia Place
- 5287 Magonlia Grove Way Unit 179
- 5288 Magnolia Place Unit 189
- 5308 Magnolia Place Unit 184
- 19 Fourth St
- 4245 Pearhaven Ln SW
- 25 Fourth St
- 4405 Chestnut Oak Way SW
- 4417 Chestnut Oak Way SW
- 4613 Water Oak Ct SW
- 4615 Silver Oak Dr SW
- 4644 Brayden Dr
- 4489 Mill Oak Way SW
- 4380 Rockrose Green Way
- 4387 Pleasant Garden Dr SW
- 2864 Pinecrest Dr
- 3607 Titshaw Dr
- 3603 Titshaw Dr
- 3611 Titshaw Dr
- 2860 Pinecrest Dr
- 2869 Pinecrest Dr
- 3616 Titshaw Dr
- 3615 Titshaw Dr
- 3612 Titshaw Dr
- 2854 Pinecrest Dr
- 2854 Pinecrest Dr
- 2863 Pinecrest Dr
- 2854 Pinecrest Dr
- 2854 Pinecrest Dr
- 3617 Titshaw Dr
- 2848 Pinecrest Dr
- 2865 Pinecrest Dr
- 3610 Titshaw Dr
- 2844 Pinecrest Dr
- 2843 Pinecrest Dr
Your Personal Tour Guide
Ask me questions while you tour the home.