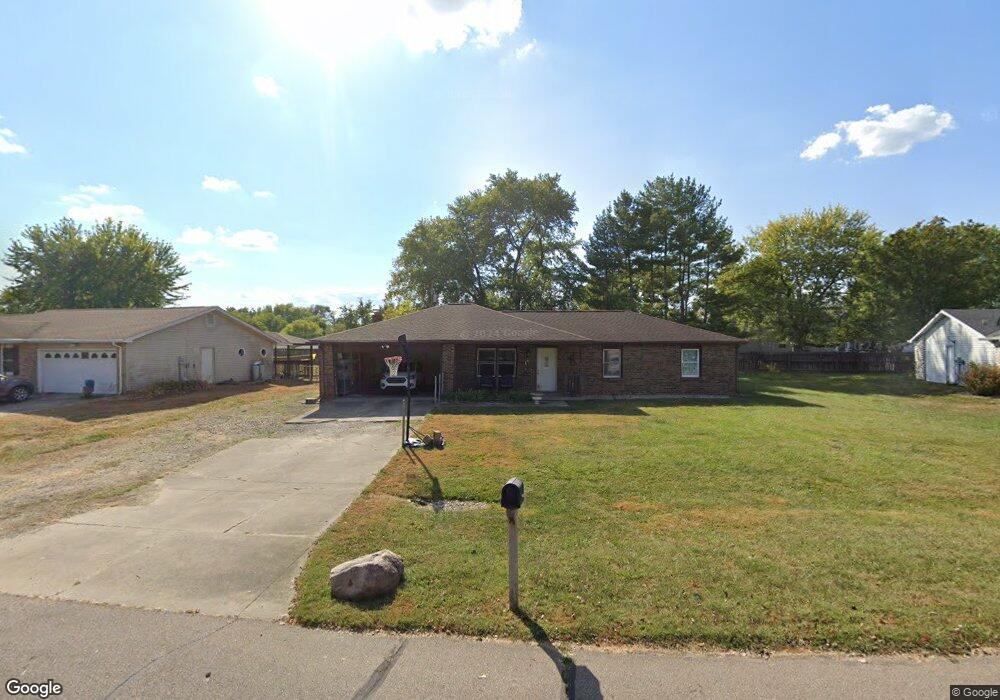
2866 Randal Ct Columbus, IN 47203
Estimated Value: $208,000 - $239,412
3
Beds
2
Baths
1,512
Sq Ft
$147/Sq Ft
Est. Value
About This Home
This home is located at 2866 Randal Ct, Columbus, IN 47203 and is currently estimated at $222,853, approximately $147 per square foot. 2866 Randal Ct is a home located in Bartholomew County with nearby schools including Clifty Creek Elementary School, Northside Middle School, and Columbus East High School.
Ownership History
Date
Name
Owned For
Owner Type
Purchase Details
Closed on
Jun 22, 2021
Sold by
Rutan Ryan S and Rutan Julie M
Bought by
Rutan Julie M
Current Estimated Value
Purchase Details
Closed on
Aug 31, 2010
Sold by
The Sec Of Hud
Bought by
Rutan Julie M and Rutan Ryan S
Purchase Details
Closed on
Jun 16, 2010
Sold by
Not Provided
Bought by
Not Provided
Purchase Details
Closed on
May 11, 2010
Sold by
Gorbett Sheriff Mark
Bought by
Fifth Third Mortgage Corp
Purchase Details
Closed on
Jul 8, 2008
Sold by
Lamb Cortney A and Smith Tuart A
Bought by
Smith Stuart A
Purchase Details
Closed on
Sep 14, 2007
Sold by
Jarrett Dustin
Bought by
Lamb Cortney A and Smith Stuart A
Purchase Details
Closed on
Nov 10, 2006
Sold by
Lynch Eloise and Lynch Hugh M
Bought by
Jarrett Dustin
Purchase Details
Closed on
May 5, 2005
Sold by
Netbank
Bought by
Federal National Mortgage Association
Purchase Details
Closed on
May 3, 2005
Sold by
Sheriff Of Bartholomew County
Bought by
Netbank
Create a Home Valuation Report for This Property
The Home Valuation Report is an in-depth analysis detailing your home's value as well as a comparison with similar homes in the area
Home Values in the Area
Average Home Value in this Area
Purchase History
| Date | Buyer | Sale Price | Title Company |
|---|---|---|---|
| Rutan Julie M | -- | None Available | |
| Rutan Julie M | $94,500 | -- | |
| Rutan Ryan S | $94,500 | -- | |
| Not Provided | $94,500 | -- | |
| Fifth Third Mortgage Corp | $117,333 | -- | |
| Smith Stuart A | -- | None Available | |
| Lamb Cortney A | -- | Attorney | |
| Jarrett Dustin | -- | Attorney | |
| Federal National Mortgage Association | -- | Attorney | |
| Netbank | $62,199 | Attorney |
Source: Public Records
Mortgage History
| Date | Status | Borrower | Loan Amount |
|---|---|---|---|
| Closed | Netbank | $0 |
Source: Public Records
Tax History Compared to Growth
Tax History
| Year | Tax Paid | Tax Assessment Tax Assessment Total Assessment is a certain percentage of the fair market value that is determined by local assessors to be the total taxable value of land and additions on the property. | Land | Improvement |
|---|---|---|---|---|
| 2024 | $1,411 | $196,500 | $30,500 | $166,000 |
| 2023 | $1,121 | $168,300 | $30,500 | $137,800 |
| 2022 | $1,204 | $168,300 | $30,500 | $137,800 |
| 2021 | $1,132 | $158,900 | $18,300 | $140,600 |
| 2020 | $749 | $119,800 | $18,300 | $101,500 |
| 2019 | $588 | $111,200 | $18,300 | $92,900 |
| 2018 | $566 | $109,300 | $18,300 | $91,000 |
| 2017 | $469 | $99,400 | $18,300 | $81,100 |
| 2016 | $459 | $98,000 | $16,400 | $81,600 |
| 2014 | $488 | $96,400 | $16,400 | $80,000 |
Source: Public Records
Map
Nearby Homes
- 2879 Prairie Stream Way
- 6055 S Stratton Ct
- 2871 N Talley Rd
- 6001 E Pioneer Place
- 6126 Regency Dr
- 5849 Regency Dr
- 5086 Memphis Ct
- 2182 Sumpter Trail
- 2042 Sumpter Trail
- 2630 Wedgewood Dr
- 3335 Marilyn St
- 3200 Thomas Trace
- 3206 Thomas Trace
- 5161 Regency Dr
- 533 Patterson Rd
- 5157 Marco Dr
- 3055 Fox Ridge Dr
- 1712 Prairie Dr
- 2213 Chandler Ln
- 4713 Eastgate Dr