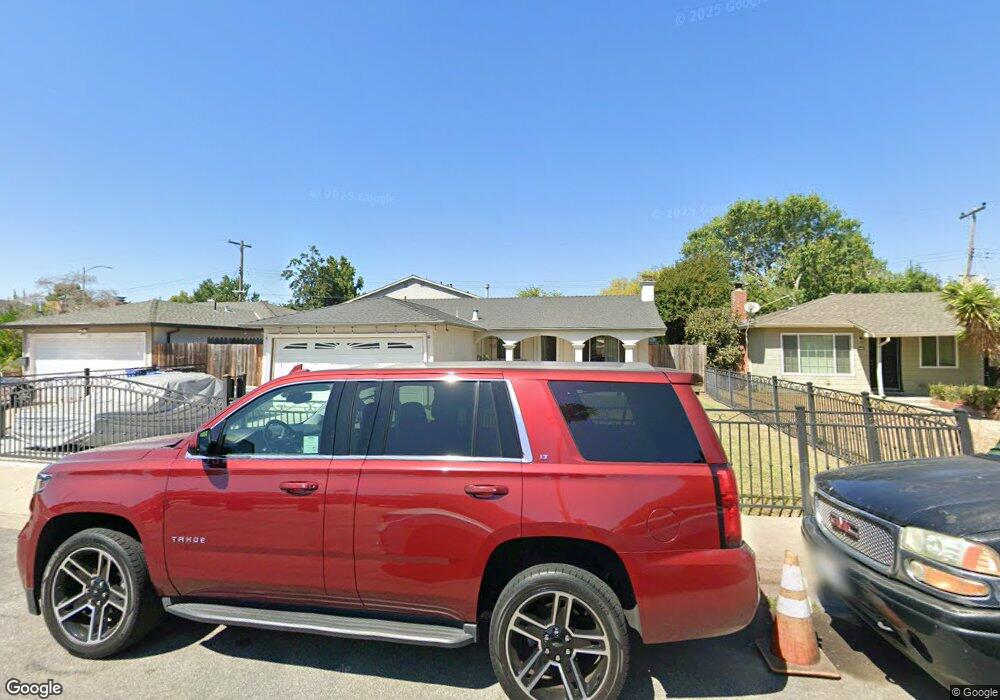
287 Corning Ave Milpitas, CA 95035
Estimated Value: $1,240,000 - $1,307,000
3
Beds
2
Baths
1,040
Sq Ft
$1,218/Sq Ft
Est. Value
About This Home
This home is located at 287 Corning Ave, Milpitas, CA 95035 and is currently estimated at $1,266,599, approximately $1,217 per square foot. 287 Corning Ave is a home located in Santa Clara County with nearby schools including Anthony Spangler Elementary School, Thomas Russell Middle School, and Milpitas High School.
Ownership History
Date
Name
Owned For
Owner Type
Purchase Details
Closed on
Jan 5, 2005
Sold by
Diaz Roberto and Diaz Yvonne R
Bought by
Diaz Roberto and Diaz Yvonne R
Current Estimated Value
Home Financials for this Owner
Home Financials are based on the most recent Mortgage that was taken out on this home.
Original Mortgage
$374,000
Outstanding Balance
$168,033
Interest Rate
4.5%
Mortgage Type
Purchase Money Mortgage
Estimated Equity
$1,098,566
Purchase Details
Closed on
May 21, 1999
Sold by
Carleton Charles H and The Carleton Family Trust
Bought by
Diaz Robert and Diaz Yvonne R
Home Financials for this Owner
Home Financials are based on the most recent Mortgage that was taken out on this home.
Original Mortgage
$226,100
Interest Rate
8.37%
Purchase Details
Closed on
Nov 23, 1993
Sold by
Carleton Helen B
Bought by
Carleton Helen B
Create a Home Valuation Report for This Property
The Home Valuation Report is an in-depth analysis detailing your home's value as well as a comparison with similar homes in the area
Home Values in the Area
Average Home Value in this Area
Purchase History
| Date | Buyer | Sale Price | Title Company |
|---|---|---|---|
| Diaz Roberto | -- | Fidelity National Title Ins | |
| Diaz Robert | $266,000 | Chicago Title Co | |
| Carleton Helen B | -- | -- |
Source: Public Records
Mortgage History
| Date | Status | Borrower | Loan Amount |
|---|---|---|---|
| Open | Diaz Roberto | $374,000 | |
| Closed | Diaz Robert | $226,100 | |
| Closed | Diaz Robert | $39,900 |
Source: Public Records
Tax History
| Year | Tax Paid | Tax Assessment Tax Assessment Total Assessment is a certain percentage of the fair market value that is determined by local assessors to be the total taxable value of land and additions on the property. | Land | Improvement |
|---|---|---|---|---|
| 2025 | $4,863 | $416,990 | $203,791 | $213,199 |
| 2024 | $4,863 | $408,815 | $199,796 | $209,019 |
| 2023 | $4,846 | $400,800 | $195,879 | $204,921 |
| 2022 | $4,827 | $392,942 | $192,039 | $200,903 |
| 2021 | $4,756 | $385,238 | $188,274 | $196,964 |
| 2020 | $4,673 | $381,289 | $186,344 | $194,945 |
| 2019 | $4,621 | $373,814 | $182,691 | $191,123 |
| 2018 | $4,392 | $366,485 | $179,109 | $187,376 |
| 2017 | $4,335 | $359,300 | $175,598 | $183,702 |
| 2016 | $4,157 | $352,255 | $172,155 | $180,100 |
| 2015 | $4,114 | $346,965 | $169,570 | $177,395 |
| 2014 | $3,994 | $340,170 | $166,249 | $173,921 |
Source: Public Records
Map
Nearby Homes
- 770 Claridad Loop
- 760 Mente Linda Loop
- 917 Vida Larga Loop
- 1030 Luz Del Sol Loop Unit 3C
- 50 Serra Way
- 600 S Abel St Unit 214
- 600 S Abel St Unit 224
- 648 S Main St
- 658 S Main St
- 660 S Main St
- 678 S Main St
- 800 S Abel St Unit 218
- 800 S Abel St Unit 100
- 45 Parc Place Dr Unit RU2808
- 845 Fire Walk Unit 368
- 52 Wind Song
- 0 Railroad Ave
- 39 Cloud Walk Unit 328
- 5 Pond Ct
- 603 Penitencia St
- 299 Corning Ave
- 275 Corning Ave
- 311 Corning Ave
- 269 Corning Ave
- 378 San Miguel Ct Unit 4
- 378 San Miguel Ct Unit 3
- 378 San Miguel Ct Unit 1
- 369 San Petra Ct Unit 4
- 369 San Petra Ct Unit 3
- 369 San Petra Ct Unit 2
- 369 San Petra Ct Unit 1
- 284 Corning Ave
- 296 Corning Ave
- 364 San Miguel Ct Unit 4
- 364 San Miguel Ct Unit 3
- 364 San Miguel Ct Unit 2
- 364 San Miguel Ct Unit 1
- 323 Corning Ave
- 272 Corning Ave
- 261 Corning Ave
Your Personal Tour Guide
Ask me questions while you tour the home.