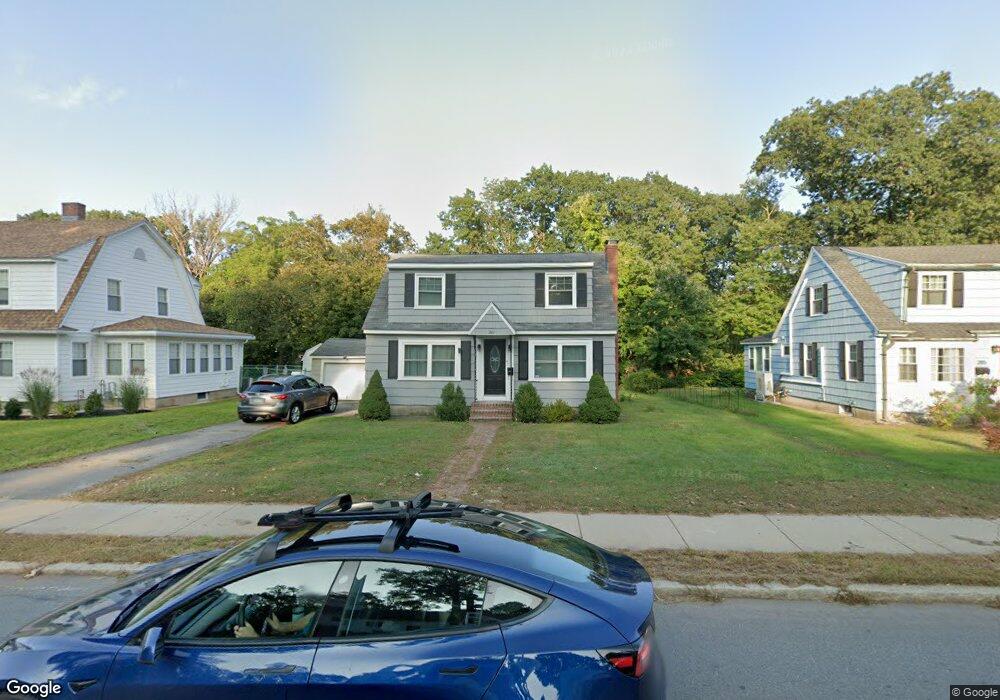
287 N Main St Unit 1 Andover, MA 01810
Shawsheen Heights NeighborhoodEstimated Value: $564,000 - $658,115
3
Beds
2
Baths
1,267
Sq Ft
$490/Sq Ft
Est. Value
About This Home
This home is located at 287 N Main St Unit 1, Andover, MA 01810 and is currently estimated at $620,279, approximately $489 per square foot. 287 N Main St Unit 1 is a home located in Essex County with nearby schools including West Elementary School, Andover West Middle School, and Andover High School.
Ownership History
Date
Name
Owned For
Owner Type
Purchase Details
Closed on
Dec 13, 2024
Sold by
Francois Jean J
Bought by
Francois Jean J and Celestin Michaela F
Current Estimated Value
Purchase Details
Closed on
Dec 27, 2019
Sold by
Schofield Joel E and Schofield Karen A
Bought by
Francois Jean J
Home Financials for this Owner
Home Financials are based on the most recent Mortgage that was taken out on this home.
Original Mortgage
$259,462
Interest Rate
3.75%
Mortgage Type
FHA
Purchase Details
Closed on
Sep 11, 2019
Sold by
Winslow Gail
Bought by
Schofield Joel E and Schofield Karen A
Home Financials for this Owner
Home Financials are based on the most recent Mortgage that was taken out on this home.
Original Mortgage
$285,000
Interest Rate
3.7%
Mortgage Type
New Conventional
Purchase Details
Closed on
May 31, 2012
Sold by
Cantwell Rt and Albanese
Bought by
Winslow Gail
Home Financials for this Owner
Home Financials are based on the most recent Mortgage that was taken out on this home.
Original Mortgage
$213,275
Interest Rate
3.9%
Mortgage Type
New Conventional
Purchase Details
Closed on
Feb 22, 2012
Sold by
Cantwell Magdalen
Bought by
Cantwell Rt and Albanese
Purchase Details
Closed on
Apr 30, 1998
Sold by
Earnshaw William G
Bought by
Cantwell Magdalen
Purchase Details
Closed on
Jun 6, 1997
Sold by
Earnshaw Donald George
Bought by
Earnshaw William G
Purchase Details
Closed on
Jan 24, 1997
Sold by
Brock Joyce Ann
Bought by
Earnshaw Donald G
Create a Home Valuation Report for This Property
The Home Valuation Report is an in-depth analysis detailing your home's value as well as a comparison with similar homes in the area
Home Values in the Area
Average Home Value in this Area
Purchase History
| Date | Buyer | Sale Price | Title Company |
|---|---|---|---|
| Francois Jean J | -- | None Available | |
| Francois Jean J | -- | None Available | |
| Francois Jean J | $377,000 | None Available | |
| Schofield Joel E | $380,000 | -- | |
| Winslow Gail | $224,500 | -- | |
| Cantwell Rt | -- | -- | |
| Cantwell Magdalen | $199,900 | -- | |
| Earnshaw William G | $162,000 | -- | |
| Earnshaw Donald G | $72,000 | -- | |
| Cantwell Rt | -- | -- | |
| Cantwell Magdalen | $199,900 | -- | |
| Earnshaw William G | $162,000 | -- | |
| Earnshaw Donald G | $72,000 | -- |
Source: Public Records
Mortgage History
| Date | Status | Borrower | Loan Amount |
|---|---|---|---|
| Previous Owner | Francois Jean J | $259,462 | |
| Previous Owner | Schofield Joel E | $285,000 | |
| Previous Owner | Winslow Gail | $213,275 |
Source: Public Records
Tax History Compared to Growth
Tax History
| Year | Tax Paid | Tax Assessment Tax Assessment Total Assessment is a certain percentage of the fair market value that is determined by local assessors to be the total taxable value of land and additions on the property. | Land | Improvement |
|---|---|---|---|---|
| 2024 | $7,313 | $567,800 | $342,600 | $225,200 |
| 2023 | $7,106 | $520,200 | $317,200 | $203,000 |
| 2022 | $6,623 | $453,600 | $268,700 | $184,900 |
| 2021 | $6,471 | $423,200 | $244,300 | $178,900 |
| 2020 | $6,202 | $413,200 | $238,300 | $174,900 |
| 2019 | $6,134 | $401,700 | $231,400 | $170,300 |
| 2018 | $5,859 | $374,600 | $218,200 | $156,400 |
| 2017 | $5,600 | $368,900 | $213,900 | $155,000 |
| 2016 | $5,467 | $368,900 | $213,900 | $155,000 |
| 2015 | $5,263 | $351,600 | $205,600 | $146,000 |
Source: Public Records
Map
Nearby Homes
- 24 York St
- 6 Windsor St
- 5 Castle Heights Rd
- 10 Martingale Ln Unit 10
- 38 Lincoln Cir E
- 156 High St
- 2 Powder Mill Square Unit 2B
- 2 Haskell Rd
- 42 Stevens St
- 20 Walnut Ave
- 1 Longwood Dr Unit 105
- 437 N Main St Unit C
- 21 Clubview Dr Unit 21
- 7-9 Buxton Ct
- 10 Maple Ave Unit 3
- 105 Elm St Unit A
- 102 Weare St
- 61 Elm St Unit 61
- 170 Haverhill St Unit 138
- 25 Clubview Dr Unit 25