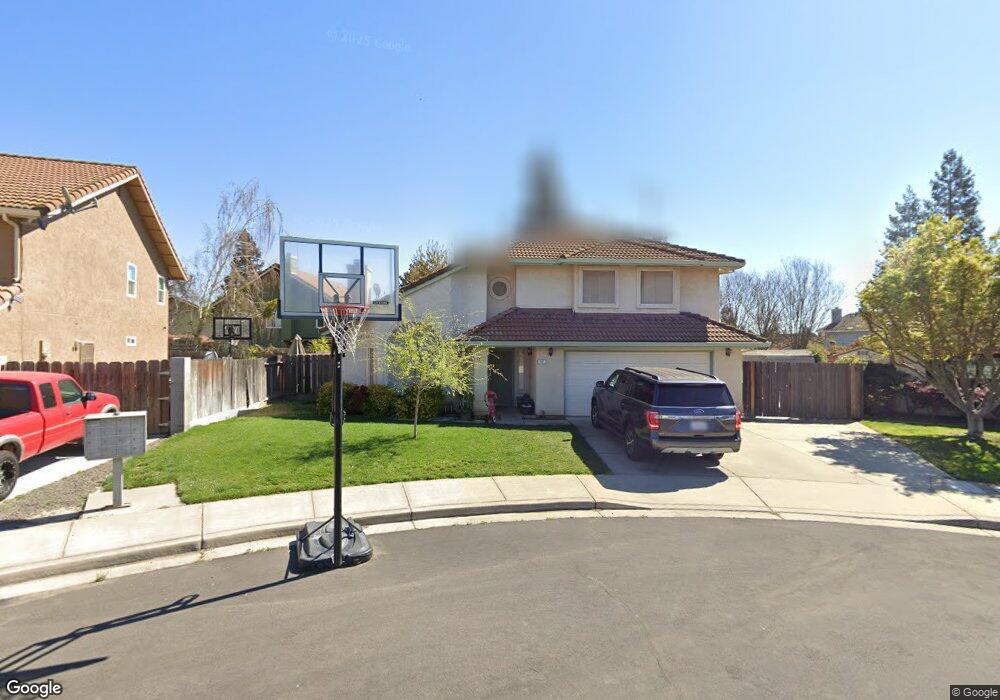
287 New Ct Oakdale, CA 95361
Estimated Value: $450,000 - $558,000
4
Beds
3
Baths
2,002
Sq Ft
$259/Sq Ft
Est. Value
About This Home
This home is located at 287 New Ct, Oakdale, CA 95361 and is currently estimated at $518,079, approximately $258 per square foot. 287 New Ct is a home located in Stanislaus County with nearby schools including Fair Oaks Elementary School, Oakdale Junior High School, and East Stanislaus High School.
Ownership History
Date
Name
Owned For
Owner Type
Purchase Details
Closed on
Jan 7, 2005
Sold by
Walsh John M and Walsh Mary E
Bought by
Walsh John M
Current Estimated Value
Home Financials for this Owner
Home Financials are based on the most recent Mortgage that was taken out on this home.
Original Mortgage
$146,000
Outstanding Balance
$73,713
Interest Rate
5.75%
Mortgage Type
New Conventional
Estimated Equity
$444,366
Purchase Details
Closed on
Jul 19, 2004
Sold by
Shelton Bennie Donald and Shelton Margaret R
Bought by
Walsh John M
Home Financials for this Owner
Home Financials are based on the most recent Mortgage that was taken out on this home.
Original Mortgage
$264,000
Outstanding Balance
$128,857
Interest Rate
5.87%
Mortgage Type
Purchase Money Mortgage
Estimated Equity
$389,222
Create a Home Valuation Report for This Property
The Home Valuation Report is an in-depth analysis detailing your home's value as well as a comparison with similar homes in the area
Home Values in the Area
Average Home Value in this Area
Purchase History
| Date | Buyer | Sale Price | Title Company |
|---|---|---|---|
| Walsh John M | -- | Chicago Title | |
| Walsh John M | -- | -- | |
| Walsh John M | $330,000 | Fidelity National Title |
Source: Public Records
Mortgage History
| Date | Status | Borrower | Loan Amount |
|---|---|---|---|
| Open | Walsh John M | $146,000 | |
| Open | Walsh John M | $264,000 |
Source: Public Records
Tax History Compared to Growth
Tax History
| Year | Tax Paid | Tax Assessment Tax Assessment Total Assessment is a certain percentage of the fair market value that is determined by local assessors to be the total taxable value of land and additions on the property. | Land | Improvement |
|---|---|---|---|---|
| 2025 | $5,056 | $459,973 | $125,444 | $334,529 |
| 2024 | $4,793 | $450,955 | $122,985 | $327,970 |
| 2023 | $4,690 | $442,114 | $120,574 | $321,540 |
| 2022 | $4,609 | $433,446 | $118,210 | $315,236 |
| 2021 | $4,531 | $424,948 | $115,893 | $309,055 |
| 2020 | $3,743 | $352,500 | $110,000 | $242,500 |
| 2019 | $3,760 | $352,500 | $110,000 | $242,500 |
| 2018 | $3,613 | $337,000 | $130,000 | $207,000 |
| 2017 | $3,396 | $316,500 | $110,000 | $206,500 |
| 2016 | $3,288 | $306,000 | $110,000 | $196,000 |
| 2015 | $3,308 | $307,000 | $58,500 | $248,500 |
| 2014 | $2,847 | $262,500 | $50,000 | $212,500 |
Source: Public Records
Map
Nearby Homes
- 8400 Crane Rd
- 2337 Rainwood Ln
- The Skyline Plan at Saddlewood
- The Pinnacle Plan at Saddlewood
- The Vantage Plan at Saddlewood
- 2295 Pontiac St
- 311 Carriage Ln
- 2306 W F St
- 1972 Sugar Pine Dr
- 1948 Sugar Pine Dr
- 2908 Westport Cir
- 15 Willowood Dr
- 2532 Laurel Ridge Ct
- 2272 Tori Way
- 1625 Valmor Ct
- 2319 Tori Way
- 549 Fresian Dr
- 2376 Shire Way
- 491 Nicholas Ct
- 2201 Mustang Dr