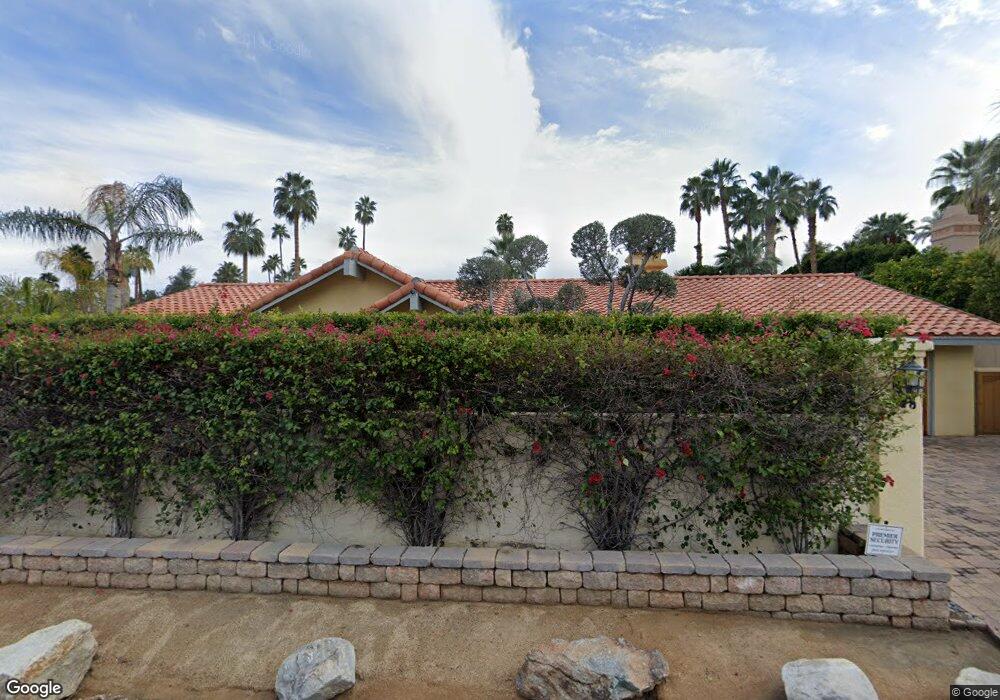
287 W El Camino Way Palm Springs, CA 92264
The Mesa NeighborhoodEstimated Value: $1,289,232 - $1,592,000
3
Beds
3
Baths
2,330
Sq Ft
$613/Sq Ft
Est. Value
About This Home
This home is located at 287 W El Camino Way, Palm Springs, CA 92264 and is currently estimated at $1,428,558, approximately $613 per square foot. 287 W El Camino Way is a home located in Riverside County with nearby schools including Cahuilla Elementary School, Raymond Cree Middle School, and Palm Springs High School.
Ownership History
Date
Name
Owned For
Owner Type
Purchase Details
Closed on
Nov 3, 2020
Sold by
Peck David E and Duca Dennis C
Bought by
Duca Dennis Carmine and Peck David Eugene
Current Estimated Value
Purchase Details
Closed on
Feb 8, 2012
Sold by
Peck David E and Duca Dennis C
Bought by
Peck David E and Duca Dennis
Home Financials for this Owner
Home Financials are based on the most recent Mortgage that was taken out on this home.
Original Mortgage
$395,000
Outstanding Balance
$270,226
Interest Rate
3.86%
Mortgage Type
New Conventional
Estimated Equity
$1,158,332
Purchase Details
Closed on
May 3, 2010
Sold by
Peck David E and Duca Dennis C
Bought by
Peck David E and Duca Dennis C
Home Financials for this Owner
Home Financials are based on the most recent Mortgage that was taken out on this home.
Original Mortgage
$417,000
Interest Rate
5.21%
Mortgage Type
New Conventional
Purchase Details
Closed on
Dec 8, 2006
Sold by
Peck David E and Duca Dennis C
Bought by
Peck David E and Duca Dennis C
Purchase Details
Closed on
Feb 7, 2006
Sold by
Duca Dennis C and Peck David E
Bought by
Peck David E and Duca Dennis C
Home Financials for this Owner
Home Financials are based on the most recent Mortgage that was taken out on this home.
Original Mortgage
$250,000
Interest Rate
6.16%
Mortgage Type
Credit Line Revolving
Purchase Details
Closed on
Dec 29, 2003
Sold by
Shanley Michael E and Shanley Nancy Dolensek
Bought by
Duca Dennis C and Peck David E
Home Financials for this Owner
Home Financials are based on the most recent Mortgage that was taken out on this home.
Original Mortgage
$546,000
Interest Rate
4.37%
Mortgage Type
Purchase Money Mortgage
Purchase Details
Closed on
Mar 13, 2000
Sold by
Pitigliano Stella
Bought by
Shanley Michael E and Shanley Nancy Dolensek
Home Financials for this Owner
Home Financials are based on the most recent Mortgage that was taken out on this home.
Original Mortgage
$224,000
Interest Rate
10%
Purchase Details
Closed on
Jun 9, 1994
Sold by
Pitigliano Frank D
Bought by
Pitigliano Stella
Purchase Details
Closed on
Dec 20, 1993
Sold by
Pitigliano Frank D
Bought by
Pitigliano Stella
Home Financials for this Owner
Home Financials are based on the most recent Mortgage that was taken out on this home.
Original Mortgage
$143,000
Interest Rate
7.38%
Create a Home Valuation Report for This Property
The Home Valuation Report is an in-depth analysis detailing your home's value as well as a comparison with similar homes in the area
Home Values in the Area
Average Home Value in this Area
Purchase History
| Date | Buyer | Sale Price | Title Company |
|---|---|---|---|
| Duca Dennis Carmine | -- | None Available | |
| Peck David E | -- | Accommodation | |
| Peck David E | -- | Fidelity National Title Co | |
| Peck David E | -- | None Available | |
| Peck David E | -- | Fidelity Natl Title Co Ie | |
| Peck David E | -- | None Available | |
| Peck David E | -- | Fidelity National Title Co | |
| Peck David E | -- | Fidelity National Title Co | |
| Duca Dennis C | $675,000 | -- | |
| Shanley Michael E | $449,000 | First American Title Co | |
| Pitigliano Stella | -- | -- | |
| Pitigliano Stella | -- | Fidelity National Title |
Source: Public Records
Mortgage History
| Date | Status | Borrower | Loan Amount |
|---|---|---|---|
| Open | Peck David E | $395,000 | |
| Closed | Peck David E | $417,000 | |
| Closed | Peck David E | $250,000 | |
| Closed | Duca Dennis C | $546,000 | |
| Previous Owner | Shanley Michael E | $224,000 | |
| Previous Owner | Pitigliano Stella | $143,000 |
Source: Public Records
Tax History Compared to Growth
Tax History
| Year | Tax Paid | Tax Assessment Tax Assessment Total Assessment is a certain percentage of the fair market value that is determined by local assessors to be the total taxable value of land and additions on the property. | Land | Improvement |
|---|---|---|---|---|
| 2025 | $9,283 | $763,412 | $284,345 | $479,067 |
| 2023 | $9,283 | $733,769 | $273,304 | $460,465 |
| 2022 | $9,467 | $719,383 | $267,946 | $451,437 |
| 2021 | $9,274 | $705,279 | $262,693 | $442,586 |
| 2020 | $8,856 | $698,048 | $260,000 | $438,048 |
| 2019 | $8,701 | $684,361 | $254,902 | $429,459 |
| 2018 | $8,537 | $670,943 | $249,905 | $421,038 |
| 2017 | $8,410 | $657,788 | $245,005 | $412,783 |
| 2016 | $8,162 | $644,891 | $240,201 | $404,690 |
| 2015 | $7,841 | $635,206 | $236,594 | $398,612 |
| 2014 | $7,753 | $622,764 | $231,960 | $390,804 |
Source: Public Records
Map
Nearby Homes
- 1821 W Crestview Dr
- 8 Ridge Rd
- 294 W Crestview Dr
- 0 Ridge Rd Unit 219131556PS
- 1 Ridge Rd
- 1861 S Palm Canyon Dr
- 766 Obsidian Loop E Unit 64
- 1961 S Palm Canyon Dr Unit 4
- 1961 S Palm Canyon Dr Unit 2
- 1961 S Palm Canyon Dr
- 1950 S Palm Canyon Dr Unit 137
- 1950 S Palm Canyon Dr Unit 131
- 1950 S Palm Canyon Unit 144
- 248 Lei Dr
- 171 Calle Bravo
- 215 Calle Bravo
- 313 Kona Ln
- 0 W Camino Buena Vista Unit 25589569PS
- 315 Kona Ln
- 495 E Twin Palms Dr
- 299 W El Camino Way
- 279 W El Camino Way
- 262 W Crestview Dr
- 250 W Crestview Dr
- 266 W Crestview Dr
- 240 W Crestview Dr
- 257 W El Camino Way
- 282 W El Camino Way
- 322 W Crestview Dr
- 0 W Crestview Dr
- 230 W Crestview Dr
- 233 W El Camino Way
- 240 W El Camino Way
- 345 Ridge Rd
- 224 W Crestview Dr
- 333 Ridge Rd
- 320 W El Camino Way
- 259 W Crestview Dr
- 265 W Crestview Dr
- 355 Ridge Rd