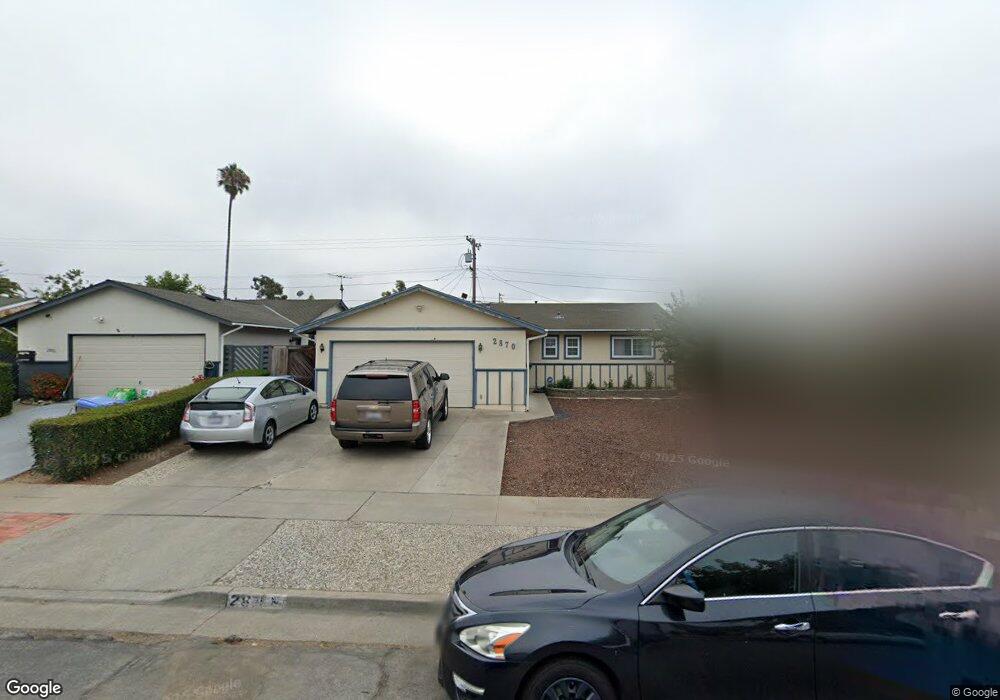
2870 Betsy Way San Jose, CA 95133
Penitencia NeighborhoodEstimated Value: $1,092,000 - $1,349,000
3
Beds
2
Baths
1,144
Sq Ft
$1,011/Sq Ft
Est. Value
About This Home
This home is located at 2870 Betsy Way, San Jose, CA 95133 and is currently estimated at $1,156,707, approximately $1,011 per square foot. 2870 Betsy Way is a home located in Santa Clara County with nearby schools including Ben Painter Elementary School, William Sheppard Middle School, and James Lick High School.
Ownership History
Date
Name
Owned For
Owner Type
Purchase Details
Closed on
Dec 20, 2010
Sold by
Casorla Jose M
Bought by
Le Dai M
Current Estimated Value
Home Financials for this Owner
Home Financials are based on the most recent Mortgage that was taken out on this home.
Original Mortgage
$231,000
Outstanding Balance
$152,228
Interest Rate
4.17%
Mortgage Type
New Conventional
Estimated Equity
$1,004,479
Purchase Details
Closed on
Jan 21, 2008
Sold by
Casorla Jose M and Casorla Maria C
Bought by
Casorla Jose M
Purchase Details
Closed on
Sep 30, 2004
Sold by
Perera Roshan and Colford Angela
Bought by
Casorla Jose M and Casorla Maria C
Home Financials for this Owner
Home Financials are based on the most recent Mortgage that was taken out on this home.
Original Mortgage
$400,000
Interest Rate
4.75%
Mortgage Type
Purchase Money Mortgage
Purchase Details
Closed on
Mar 26, 1999
Sold by
Deborah A Gear Separate Property 10/1 and Deborah A
Bought by
Perera Roshan and Colford Angela
Home Financials for this Owner
Home Financials are based on the most recent Mortgage that was taken out on this home.
Original Mortgage
$208,000
Interest Rate
6.91%
Purchase Details
Closed on
Oct 13, 1994
Sold by
Gear Debbie A
Bought by
Gear Deborah A
Create a Home Valuation Report for This Property
The Home Valuation Report is an in-depth analysis detailing your home's value as well as a comparison with similar homes in the area
Home Values in the Area
Average Home Value in this Area
Purchase History
| Date | Buyer | Sale Price | Title Company |
|---|---|---|---|
| Le Dai M | $330,000 | Fidelity National Title Co | |
| Casorla Jose M | -- | None Available | |
| Casorla Jose M | $520,000 | Financial Title Company | |
| Perera Roshan | $260,000 | Chicago Title Co | |
| Gear Deborah A | -- | -- |
Source: Public Records
Mortgage History
| Date | Status | Borrower | Loan Amount |
|---|---|---|---|
| Open | Le Dai M | $231,000 | |
| Previous Owner | Casorla Jose M | $400,000 | |
| Previous Owner | Perera Roshan | $208,000 | |
| Closed | Casorla Jose M | $94,000 |
Source: Public Records
Tax History Compared to Growth
Tax History
| Year | Tax Paid | Tax Assessment Tax Assessment Total Assessment is a certain percentage of the fair market value that is determined by local assessors to be the total taxable value of land and additions on the property. | Land | Improvement |
|---|---|---|---|---|
| 2025 | $7,068 | $422,773 | $338,223 | $84,550 |
| 2024 | $7,068 | $414,485 | $331,592 | $82,893 |
| 2023 | $6,913 | $406,359 | $325,091 | $81,268 |
| 2022 | $6,782 | $398,392 | $318,717 | $79,675 |
| 2021 | $6,538 | $390,581 | $312,468 | $78,113 |
| 2020 | $6,394 | $386,578 | $309,265 | $77,313 |
| 2019 | $6,214 | $378,999 | $303,201 | $75,798 |
| 2018 | $6,126 | $371,568 | $297,256 | $74,312 |
| 2017 | $6,137 | $364,283 | $291,428 | $72,855 |
| 2016 | $5,795 | $357,141 | $285,714 | $71,427 |
| 2015 | $5,785 | $351,778 | $281,423 | $70,355 |
| 2014 | $5,293 | $344,888 | $275,911 | $68,977 |
Source: Public Records
Map
Nearby Homes
- 2623 Gimelli Place Unit 139
- 2599 Easton Ln Unit 108
- 2599 Easton Ln Unit 109
- 750 Fruit Ranch Loop
- 673 Kirk Glen Dr
- 2580 Gimelli Way
- 714 N Capitol Ave
- 559 Apricot Way
- 571 Apricot Way
- 2714 Mabury Square
- 693 Kirk Glen Dr
- 2420 Kita Ln
- 674 Galleon Ct
- 633 Easton Dr
- 709 Whitewater Ct Unit 44
- 811 Salt Lake Dr
- 2806 Glauser Dr
- 259 N Capitol Ave Unit 171
- 259 N Capitol Ave Unit 131
- 259 N Capitol Ave Unit 116