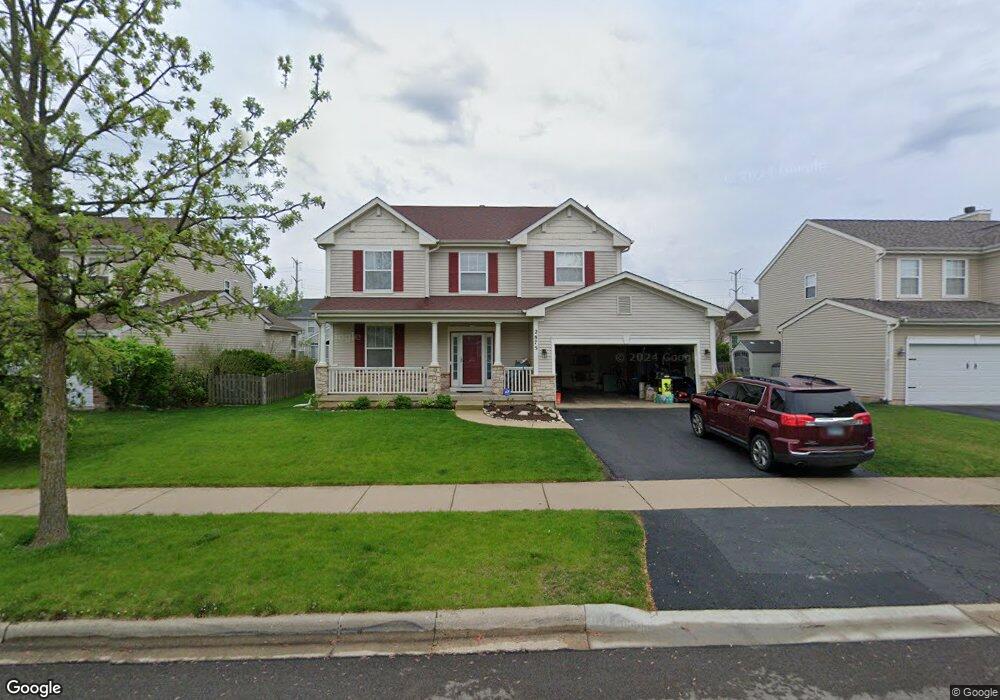
2875 Frances Ln Unit 1 Montgomery, IL 60538
South Montgomery NeighborhoodEstimated Value: $418,000 - $455,000
4
Beds
3
Baths
2,671
Sq Ft
$161/Sq Ft
Est. Value
About This Home
This home is located at 2875 Frances Ln Unit 1, Montgomery, IL 60538 and is currently estimated at $431,351, approximately $161 per square foot. 2875 Frances Ln Unit 1 is a home located in Kendall County with nearby schools including Lakewood Creek Elementary School, Thompson Jr. High School, and Oswego High School.
Ownership History
Date
Name
Owned For
Owner Type
Purchase Details
Closed on
Apr 6, 2017
Sold by
Combs Ann and Santeusanio Ann
Bought by
Thomas Gregory and Thomas Sandra
Current Estimated Value
Home Financials for this Owner
Home Financials are based on the most recent Mortgage that was taken out on this home.
Original Mortgage
$234,650
Outstanding Balance
$194,276
Interest Rate
4.37%
Mortgage Type
New Conventional
Estimated Equity
$237,075
Purchase Details
Closed on
Jan 1, 2015
Sold by
Combs Raimund M and Combs Raimund M
Bought by
Combs Ann
Purchase Details
Closed on
Oct 15, 2004
Sold by
William Ryan Homes Inc
Bought by
Combs Raimund M
Home Financials for this Owner
Home Financials are based on the most recent Mortgage that was taken out on this home.
Original Mortgage
$214,424
Interest Rate
4.25%
Mortgage Type
Purchase Money Mortgage
Create a Home Valuation Report for This Property
The Home Valuation Report is an in-depth analysis detailing your home's value as well as a comparison with similar homes in the area
Home Values in the Area
Average Home Value in this Area
Purchase History
| Date | Buyer | Sale Price | Title Company |
|---|---|---|---|
| Thomas Gregory | $247,000 | Attorneys Title Guaranty Fun | |
| Combs Ann | -- | -- | |
| Combs Raimund M | $268,500 | Ticor Title |
Source: Public Records
Mortgage History
| Date | Status | Borrower | Loan Amount |
|---|---|---|---|
| Open | Thomas Gregory | $234,650 | |
| Previous Owner | Combs Raimund M | $214,424 |
Source: Public Records
Tax History
| Year | Tax Paid | Tax Assessment Tax Assessment Total Assessment is a certain percentage of the fair market value that is determined by local assessors to be the total taxable value of land and additions on the property. | Land | Improvement |
|---|---|---|---|---|
| 2024 | $10,024 | $129,030 | $13,302 | $115,728 |
| 2023 | $9,149 | $115,441 | $11,901 | $103,540 |
| 2022 | $9,149 | $104,803 | $10,804 | $93,999 |
| 2021 | $8,792 | $97,840 | $10,804 | $87,036 |
| 2020 | $8,456 | $93,296 | $10,804 | $82,492 |
| 2019 | $8,239 | $89,716 | $10,389 | $79,327 |
| 2018 | $8,017 | $84,820 | $10,389 | $74,431 |
| 2017 | $7,839 | $79,307 | $10,389 | $68,918 |
| 2016 | $3,988 | $78,925 | $10,389 | $68,536 |
| 2015 | $7,198 | $68,276 | $9,354 | $58,922 |
| 2014 | -- | $65,470 | $9,354 | $56,116 |
| 2013 | -- | $65,470 | $9,354 | $56,116 |
Source: Public Records
Map
Nearby Homes
- 2101 Chad Ln
- 968 Sapphire Ln
- 971 Sapphire Ln
- 983 Sapphire Ln
- 984 Sapphire Ln
- 972 Sapphire Ln
- 980 Sapphire Ln
- 988 Sapphire Ln
- 2914 Meadowview Ln
- 2031 Matthew Dr Unit 1
- 1851 Simpson Ct
- 3014 Shetland Ln
- 2978 Fairfield Way
- 1853 Candlelight Cir Unit 183
- 3051 Patterson Rd
- 3108 Manchester Dr
- 2468 Roxbury Ln
- 2459 Mayfield Dr
- 2492 Concord Ct
- 4476 E Millbrook Cir
- 2871 Frances Ln
- 2879 Frances Ln
- 2874 Troon Dr
- 2867 Frances Ln
- 2883 Frances Ln
- 2878 Troon Dr Unit 1
- 2870 Troon Dr Unit 1
- 2882 Troon Dr
- 2866 Troon Dr
- 2874 Frances Ln
- 2863 Frances Ln
- 2887 Frances Ln
- 2878 Frances Ln
- 2870 Frances Ln
- 2886 Troon Dr
- 2882 Frances Ln Unit 1
- 2862 Troon Dr
- 2866 Frances Ln
- 2859 Frances Ln
- 2886 Frances Ln
Your Personal Tour Guide
Ask me questions while you tour the home.