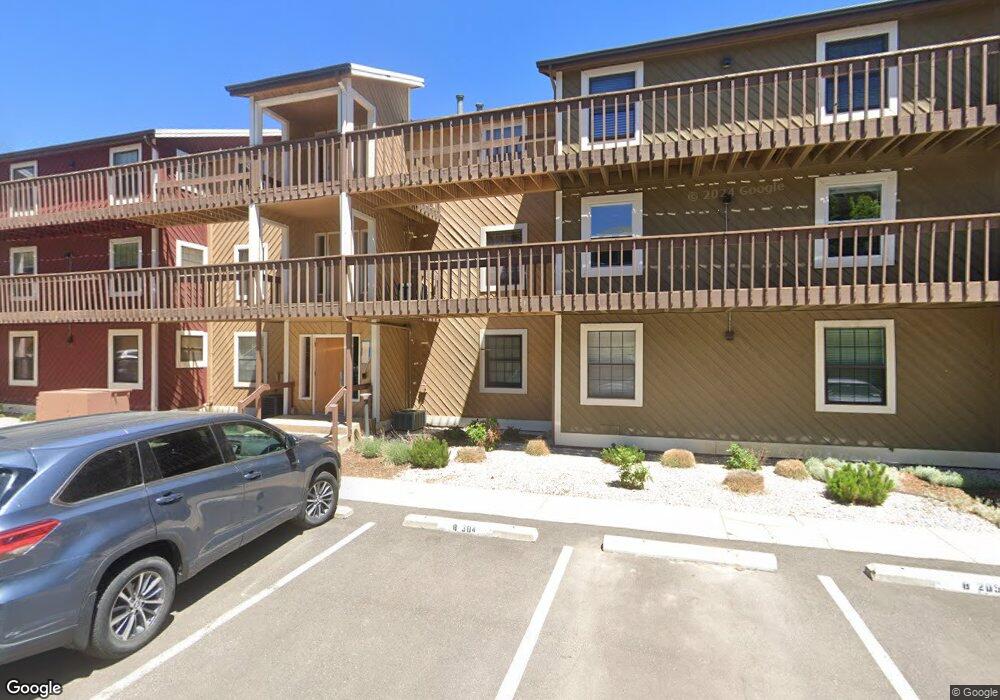
2877 Shadow Creek Dr Unit 104 Boulder, CO 80303
University of Colorado Boulder Area NeighborhoodEstimated Value: $302,036 - $410,000
1
Bed
1
Bath
527
Sq Ft
$682/Sq Ft
Est. Value
About This Home
This home is located at 2877 Shadow Creek Dr Unit 104, Boulder, CO 80303 and is currently estimated at $359,259, approximately $681 per square foot. 2877 Shadow Creek Dr Unit 104 is a home located in Boulder County with nearby schools including Creekside Elementary School, Manhattan Middle School of the Arts & Academics, and Fairview High School.
Ownership History
Date
Name
Owned For
Owner Type
Purchase Details
Closed on
Jan 18, 2000
Sold by
Haynes Lyle R
Bought by
Mooney William P and Mooney Valorie G
Current Estimated Value
Home Financials for this Owner
Home Financials are based on the most recent Mortgage that was taken out on this home.
Original Mortgage
$97,500
Outstanding Balance
$31,025
Interest Rate
7.86%
Estimated Equity
$328,234
Purchase Details
Closed on
Nov 22, 1996
Sold by
Graham Billy D and Graham Rosalind W
Bought by
Haynes Lyle R
Home Financials for this Owner
Home Financials are based on the most recent Mortgage that was taken out on this home.
Original Mortgage
$81,942
Interest Rate
7.84%
Mortgage Type
FHA
Purchase Details
Closed on
Nov 25, 1991
Bought by
Mooney William P and Mooney Valorie G
Purchase Details
Closed on
Apr 22, 1982
Bought by
Mooney William P and Mooney Valorie G
Create a Home Valuation Report for This Property
The Home Valuation Report is an in-depth analysis detailing your home's value as well as a comparison with similar homes in the area
Home Values in the Area
Average Home Value in this Area
Purchase History
| Date | Buyer | Sale Price | Title Company |
|---|---|---|---|
| Mooney William P | $130,000 | -- | |
| Haynes Lyle R | $84,100 | Land Title | |
| Mooney William P | $65,500 | -- | |
| Mooney William P | -- | -- |
Source: Public Records
Mortgage History
| Date | Status | Borrower | Loan Amount |
|---|---|---|---|
| Open | Mooney William P | $97,500 | |
| Previous Owner | Haynes Lyle R | $81,942 |
Source: Public Records
Tax History Compared to Growth
Tax History
| Year | Tax Paid | Tax Assessment Tax Assessment Total Assessment is a certain percentage of the fair market value that is determined by local assessors to be the total taxable value of land and additions on the property. | Land | Improvement |
|---|---|---|---|---|
| 2025 | $1,381 | $19,713 | -- | $19,713 |
| 2024 | $1,381 | $19,713 | -- | $19,713 |
| 2023 | $1,357 | $15,710 | -- | $19,395 |
| 2022 | $1,417 | $15,262 | $0 | $15,262 |
| 2021 | $1,351 | $15,701 | $0 | $15,701 |
| 2020 | $1,647 | $18,926 | $0 | $18,926 |
| 2019 | $1,622 | $18,926 | $0 | $18,926 |
| 2018 | $1,428 | $16,474 | $0 | $16,474 |
| 2017 | $1,384 | $18,212 | $0 | $18,212 |
| 2016 | $1,171 | $13,532 | $0 | $13,532 |
| 2015 | $1,109 | $11,924 | $0 | $11,924 |
| 2014 | $1,025 | $11,924 | $0 | $11,924 |
Source: Public Records
Map
Nearby Homes
- 2865 Sundown Ln Unit 108
- 2902 Shadow Creek Dr Unit 204
- 2800 Sundown Ln Unit 109
- 2802 Sundown Ln Unit 102
- 2960 Shadow Creek Dr Unit 101
- 2801 Pennsylvania Ave Unit 203
- 2850 E College Ave Unit 110
- 2850 E College Ave Unit 301
- 2510 Taft Dr Unit 312
- 2510 Taft Dr Unit 205
- 3000 Colorado Ave Unit F122
- 3000 Colorado Ave Unit D114
- 3000 Colorado Ave Unit 122F
- 3000 Colorado Ave Unit B206
- 3009 Madison Ave Unit M-315
- 3401 Arapahoe Ave Unit 309
- 3301 Arapahoe Ave Unit 405
- 3301 Arapahoe Ave Unit 107
- 3601 Arapahoe Ave Unit 408
- 2205 Arapahoe Ave Unit 3
- 2877 Shadow Creek Dr Unit 304
- 2877 Shadow Creek Dr Unit 303
- 2877 Shadow Creek Dr Unit 204
- 2877 Shadow Creek Dr Unit 203
- 2877 Shadow Creek Dr Unit 103
- 2877 Shadow Creek Dr
- 2879 Shadow Creek Dr Unit 305
- 2879 Shadow Creek Dr Unit 206
- 2879 Shadow Creek Dr Unit 106
- 2879 Shadow Creek Dr Unit 105
- 2879 Shadow Creek Dr Unit 205
- 2875 Shadow Creek Dr Unit 302
- 2875 Shadow Creek Dr Unit 301
- 2875 Shadow Creek Dr Unit 202
- 2875 Shadow Creek Dr Unit 201
- 2875 Shadow Creek Dr Unit 102
- 2875 Shadow Creek Dr Unit 101
- 2875 Shadow Creek Dr Unit B
- 2875 Shadow Creek Dr Unit 205
- 2875 Shadow Creek Dr