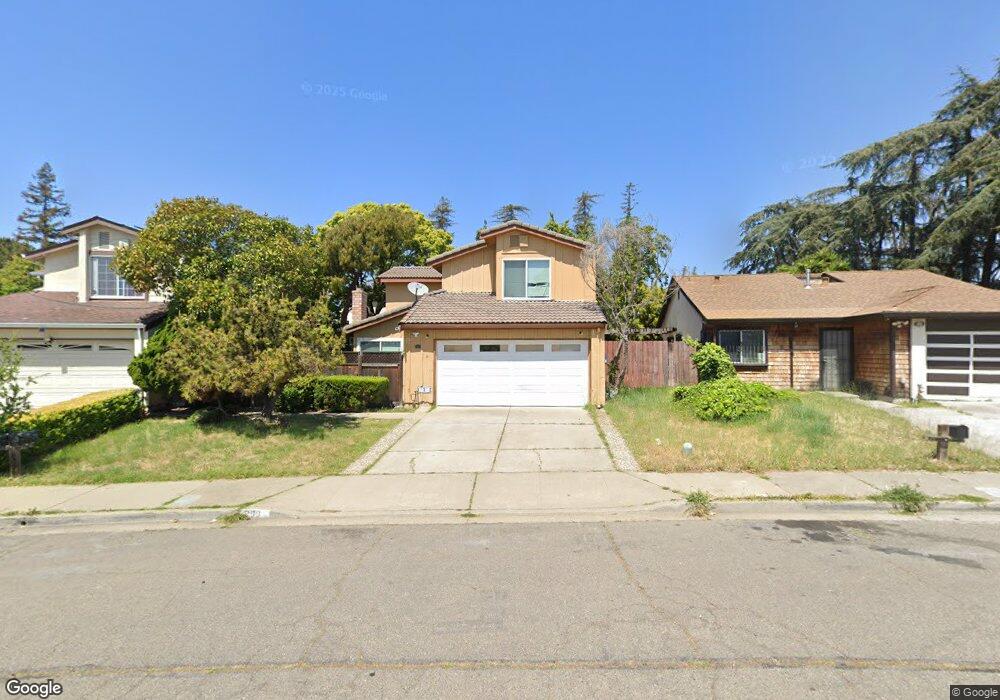
288 Ebony Way Hayward, CA 94544
Whitman-Wocine NeighborhoodEstimated Value: $808,613 - $967,000
4
Beds
--
Bath
1,499
Sq Ft
$581/Sq Ft
Est. Value
About This Home
This home is located at 288 Ebony Way, Hayward, CA 94544 and is currently estimated at $870,403, approximately $580 per square foot. 288 Ebony Way is a home located in Alameda County with nearby schools including Tyrrell Elementary School, Cesar Chavez Middle School, and Tennyson High School.
Ownership History
Date
Name
Owned For
Owner Type
Purchase Details
Closed on
Jul 22, 2020
Sold by
Vo Duke H and Vo Amy L
Bought by
Vo Duke H and Vo Amy L
Current Estimated Value
Home Financials for this Owner
Home Financials are based on the most recent Mortgage that was taken out on this home.
Original Mortgage
$338,200
Outstanding Balance
$300,450
Interest Rate
3.2%
Mortgage Type
New Conventional
Estimated Equity
$569,953
Create a Home Valuation Report for This Property
The Home Valuation Report is an in-depth analysis detailing your home's value as well as a comparison with similar homes in the area
Home Values in the Area
Average Home Value in this Area
Purchase History
| Date | Buyer | Sale Price | Title Company |
|---|---|---|---|
| Vo Duke H | -- | Accommodation | |
| Vo Duke H | -- | Lawyers Title Sd |
Source: Public Records
Mortgage History
| Date | Status | Borrower | Loan Amount |
|---|---|---|---|
| Open | Vo Duke H | $338,200 |
Source: Public Records
Tax History Compared to Growth
Tax History
| Year | Tax Paid | Tax Assessment Tax Assessment Total Assessment is a certain percentage of the fair market value that is determined by local assessors to be the total taxable value of land and additions on the property. | Land | Improvement |
|---|---|---|---|---|
| 2025 | $3,349 | $255,914 | $77,692 | $178,222 |
| 2024 | $3,349 | $250,895 | $76,168 | $174,727 |
| 2023 | $3,301 | $245,976 | $74,675 | $171,301 |
| 2022 | $3,240 | $241,154 | $73,211 | $167,943 |
| 2021 | $3,214 | $236,427 | $71,776 | $164,651 |
| 2020 | $3,181 | $234,003 | $71,040 | $162,963 |
| 2019 | $4,119 | $229,415 | $69,647 | $159,768 |
| 2018 | $3,968 | $224,918 | $68,282 | $156,636 |
| 2017 | $3,786 | $220,508 | $66,943 | $153,565 |
| 2016 | $3,533 | $216,185 | $65,631 | $150,554 |
| 2015 | $2,723 | $212,938 | $64,645 | $148,293 |
| 2014 | $2,828 | $208,768 | $63,379 | $145,389 |
Source: Public Records
Map
Nearby Homes
- 26632 Luvena Dr
- 26132 Jane Ave
- 26583 Greta Ln
- 250 Schafer Rd
- 399 Schafer Rd
- Plan 1 at Fusion - Townhomes
- Plan 5-Alt at Fusion - Live-Work Homes
- Plan 5 at Fusion - Live-Work Homes
- Plan 2 at Fusion - Townhomes
- Plan 3 at Fusion - Townhomes
- Plan 4 at Fusion - Townhomes
- 26361 Huntwood Ave
- 25943 Dollar St
- 882 Harder Rd
- 27639 Eucalyptus Ct
- 27418 Susan Place Unit 3
- 25696 Lander Ave
- 318 Dumont Ave
- 26231 Gamboa St
- 28030 E 10th St
- 284 Ebony Way
- 292 Ebony Way
- 289 Jacaranda Dr
- 280 Ebony Way
- 285 Jacaranda Dr
- 293 Jacaranda Dr
- 281 Jacaranda Dr
- 277 Jacaranda Dr
- 287 Ebony Way
- 276 Ebony Way
- 291 Ebony Way
- 279 Ebony Way
- 273 Jacaranda Dr
- 26626 Voltaire St
- 272 Ebony Way
- 26644 Voltaire St
- 275 Ebony Way
- 269 Jacaranda Dr
- 26652 Voltaire St
- 26583 Voltaire St