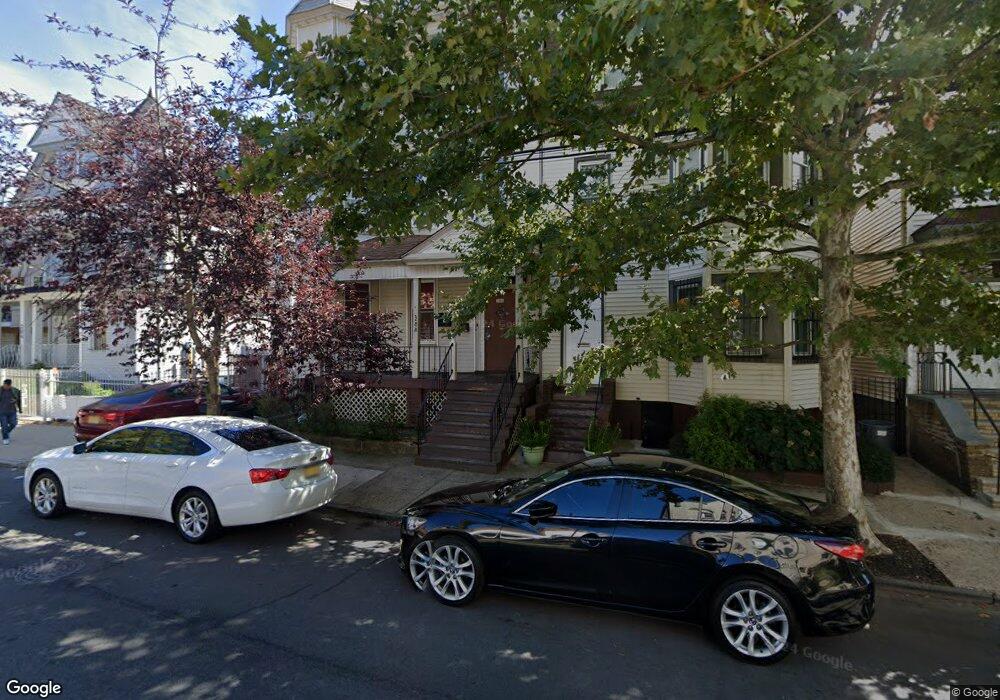
288 S 8th St Unit 2 Newark, NJ 07103
Fairmount NeighborhoodEstimated Value: $617,491 - $681,000
3
Beds
1
Bath
3,819
Sq Ft
$170/Sq Ft
Est. Value
About This Home
This home is located at 288 S 8th St Unit 2, Newark, NJ 07103 and is currently estimated at $647,373, approximately $169 per square foot. 288 S 8th St Unit 2 is a home located in Essex County with nearby schools including Camden Street Elementary School, Harriet Tubman School, and Sir Isaac Newton Elementary School.
Ownership History
Date
Name
Owned For
Owner Type
Purchase Details
Closed on
Aug 26, 2025
Sold by
288 S 8 Llc
Bought by
288 8 S Inc
Current Estimated Value
Home Financials for this Owner
Home Financials are based on the most recent Mortgage that was taken out on this home.
Original Mortgage
$756,500
Outstanding Balance
$755,833
Interest Rate
6.63%
Mortgage Type
Construction
Estimated Equity
-$108,460
Purchase Details
Closed on
Dec 17, 2024
Sold by
Abruzzese Derek
Bought by
288 S 8 Llc
Purchase Details
Closed on
Jun 4, 2021
Sold by
Guardian Holdings Llc
Bought by
Abruzzese Derek
Home Financials for this Owner
Home Financials are based on the most recent Mortgage that was taken out on this home.
Original Mortgage
$441,849
Interest Rate
2.9%
Mortgage Type
FHA
Purchase Details
Closed on
Aug 7, 2007
Sold by
Knox Walker F
Bought by
Knox Ronnie T
Home Financials for this Owner
Home Financials are based on the most recent Mortgage that was taken out on this home.
Original Mortgage
$202,238
Interest Rate
6.78%
Mortgage Type
Purchase Money Mortgage
Create a Home Valuation Report for This Property
The Home Valuation Report is an in-depth analysis detailing your home's value as well as a comparison with similar homes in the area
Home Values in the Area
Average Home Value in this Area
Purchase History
| Date | Buyer | Sale Price | Title Company |
|---|---|---|---|
| 288 8 S Inc | -- | Dekel Abstract | |
| 288 S 8 Llc | $560,000 | None Listed On Document | |
| 288 S 8 Llc | $560,000 | None Listed On Document | |
| Abruzzese Derek | $450,000 | Foundation Title Llc | |
| Knox Ronnie T | $100,000 | None Available | |
| Knox Walker F | -- | None Available |
Source: Public Records
Mortgage History
| Date | Status | Borrower | Loan Amount |
|---|---|---|---|
| Open | 288 8 S Inc | $756,500 | |
| Previous Owner | Abruzzese Derek | $441,849 | |
| Previous Owner | Knox Ronnie T | $202,238 |
Source: Public Records
Tax History Compared to Growth
Tax History
| Year | Tax Paid | Tax Assessment Tax Assessment Total Assessment is a certain percentage of the fair market value that is determined by local assessors to be the total taxable value of land and additions on the property. | Land | Improvement |
|---|---|---|---|---|
| 2025 | $7,184 | $192,700 | $27,500 | $165,200 |
| 2024 | $7,184 | $192,700 | $27,500 | $165,200 |
| 2023 | $7,199 | $192,700 | $27,500 | $165,200 |
| 2022 | $7,199 | $192,700 | $27,500 | $165,200 |
| 2021 | $7,195 | $192,700 | $27,500 | $165,200 |
| 2020 | $7,323 | $192,700 | $27,500 | $165,200 |
| 2019 | $7,247 | $192,700 | $27,500 | $165,200 |
| 2018 | $7,116 | $192,700 | $27,500 | $165,200 |
| 2017 | $6,860 | $192,700 | $27,500 | $165,200 |
| 2016 | $6,629 | $192,700 | $27,500 | $165,200 |
| 2015 | $6,376 | $192,700 | $27,500 | $165,200 |
| 2014 | $5,976 | $192,700 | $27,500 | $165,200 |
Source: Public Records
Map
Nearby Homes
- 267 S 8th St
- 265 S 8th St Unit 267
- 235 S 7th St
- 336 S 10th St Unit 338
- 338 S 10th St
- 239 S 8th St
- 348 13th Ave
- 267 S 9th St
- 184.5 S 6th St
- 414 S 10th St
- 197 Fairmount Ave
- 266 Littleton Ave
- 474 15th Ave
- 436 S 11th St
- 438 S 11th St
- 163 S 7th St
- 149 Camden St
- 417 15th Ave
- 293 13th Ave
- 119 Littleton Ave
- 288 S 8th St Unit 1
- 288 S 8th St
- 288 S 8th St Unit 3
- 290 S 8th St
- 292-294 S 8th St
- 292-294 S 8th St Unit 2
- 284 S 8th St Unit 286
- 292 S 8th St Unit 294
- 280 S 8th St Unit 282
- 259 N 7th St Unit 261
- 278 S 8th St
- 255 S 7th St
- 325 S Orange Ave Approved
- 327 S Orange Ave
- 327 S Orange Ave
- 325 S Orange Ave Unit 2
- 325 S Orange Ave
- 325 S Orange Ave
- 329 S Orange Ave Unit 3
- 329 S Orange Ave