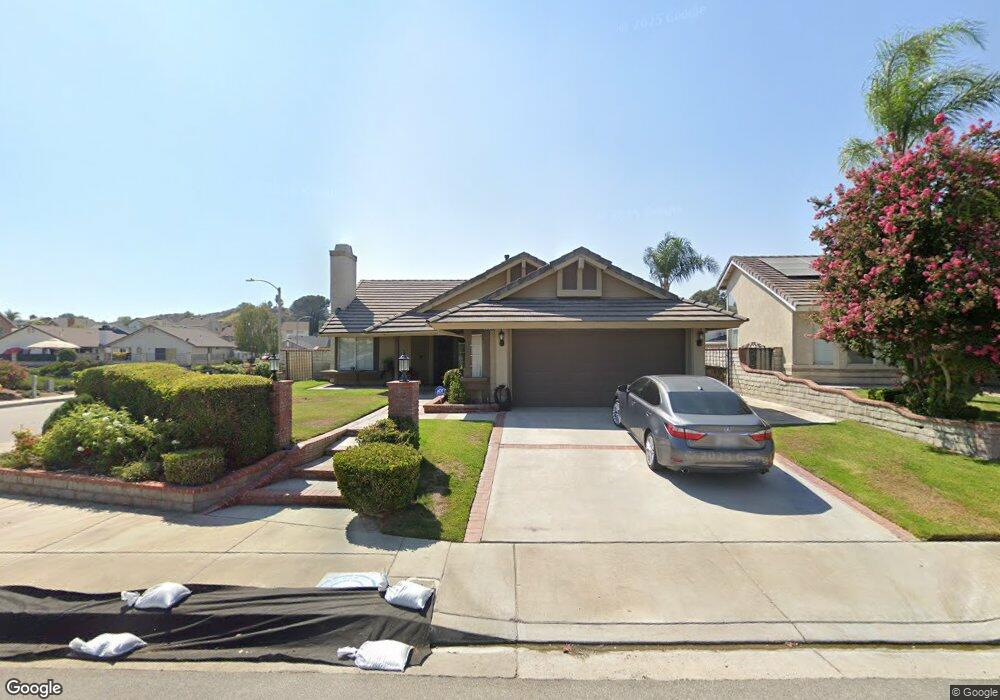
28803 Deodar Place Santa Clarita, CA 91390
Saugus NeighborhoodEstimated Value: $764,500 - $807,000
3
Beds
2
Baths
1,375
Sq Ft
$578/Sq Ft
Est. Value
About This Home
This home is located at 28803 Deodar Place, Santa Clarita, CA 91390 and is currently estimated at $794,625, approximately $577 per square foot. 28803 Deodar Place is a home located in Los Angeles County with nearby schools including Mountainview Elementary School, Rio Norte Junior High School, and Valencia High School.
Ownership History
Date
Name
Owned For
Owner Type
Purchase Details
Closed on
Jan 29, 2018
Sold by
Hicks Vivian Leonne
Bought by
Hicks Vivian Leonne and The Vivian Leonne Hicks Trust
Current Estimated Value
Purchase Details
Closed on
Jan 5, 2010
Sold by
Canty Elijah J
Bought by
Hicks Vivian and Canty Elijah J
Purchase Details
Closed on
May 15, 2001
Sold by
Hicks Charles B
Bought by
Hicks Vivian
Home Financials for this Owner
Home Financials are based on the most recent Mortgage that was taken out on this home.
Original Mortgage
$142,000
Outstanding Balance
$53,454
Interest Rate
7.14%
Estimated Equity
$741,171
Purchase Details
Closed on
Apr 29, 2001
Sold by
Vriniotis Thomas and Vriniotis Amalia
Bought by
Canty Elijah J and Hicks Vivian
Home Financials for this Owner
Home Financials are based on the most recent Mortgage that was taken out on this home.
Original Mortgage
$142,000
Outstanding Balance
$53,454
Interest Rate
7.14%
Estimated Equity
$741,171
Create a Home Valuation Report for This Property
The Home Valuation Report is an in-depth analysis detailing your home's value as well as a comparison with similar homes in the area
Home Values in the Area
Average Home Value in this Area
Purchase History
| Date | Buyer | Sale Price | Title Company |
|---|---|---|---|
| Hicks Vivian Leonne | -- | None Available | |
| Hicks Vivian | -- | None Available | |
| Hicks Vivian | -- | South Coast Title | |
| Canty Elijah J | $245,000 | South Coast Title |
Source: Public Records
Mortgage History
| Date | Status | Borrower | Loan Amount |
|---|---|---|---|
| Open | Canty Elijah J | $142,000 |
Source: Public Records
Tax History Compared to Growth
Tax History
| Year | Tax Paid | Tax Assessment Tax Assessment Total Assessment is a certain percentage of the fair market value that is determined by local assessors to be the total taxable value of land and additions on the property. | Land | Improvement |
|---|---|---|---|---|
| 2025 | $6,362 | $389,555 | $201,911 | $187,644 |
| 2024 | $6,362 | $381,917 | $197,952 | $183,965 |
| 2023 | $6,134 | $374,429 | $194,071 | $180,358 |
| 2022 | $6,118 | $367,088 | $190,266 | $176,822 |
| 2021 | $5,978 | $359,891 | $186,536 | $173,355 |
| 2019 | $5,810 | $349,218 | $181,004 | $168,214 |
| 2018 | $5,649 | $342,371 | $177,455 | $164,916 |
| 2016 | $5,251 | $329,078 | $170,565 | $158,513 |
| 2015 | $5,078 | $324,135 | $168,003 | $156,132 |
| 2014 | $5,014 | $317,787 | $164,713 | $153,074 |
Source: Public Records
Map
Nearby Homes
- 28642 Apricot Place
- 29027 Raintree Ln
- 29047 Ironwood Ln
- 22939 Raintree Ln
- 29160 Harmony Way
- 28435 Seco Canyon Rd Unit 154
- 28415 Seco Canyon Rd Unit 125
- 28345 Seco Canyon Rd Unit 97
- 28341 Seco Canyon Rd Unit 107
- 22229 Evening Star Ct
- 22911 Banyan Place
- 28325 Seco Canyon Rd Unit 365
- 22440 Skylake Place
- 28321 Evergreen Ln
- 28241 Tamarack Ln
- 22114 Gold Canyon Dr
- 22943 Banyan Place Unit 306
- 22713 Copper Hill Dr Unit 42
- 28774 San Francisquito Canyon Rd
- 22617 Copper Hill Dr Unit 121
- 28809 Deodar Place
- 28813 Deodar Place
- 28775 Citrus Place
- 28808 Raintree Ln
- 28812 Raintree Ln
- 28819 Deodar Place
- 28816 Raintree Ln
- 28802 Deodar Place
- 28771 Citrus Place
- 28808 Deodar Place
- 28776 Raintree Ln
- 28822 Raintree Ln
- 28814 Deodar Place
- 28823 Deodar Place
- 28774 Citrus Place
- 28772 Raintree Ln
- 28826 Raintree Ln
- 28765 Citrus Place
- 28820 Deodar Place
- 28768 Raintree Ln