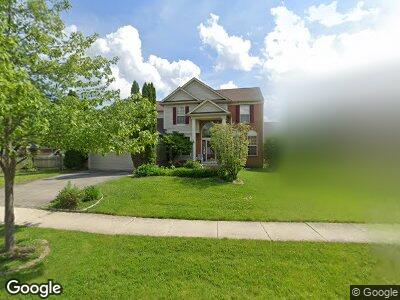
2885 Moray Ct Aurora, IL 60503
Far Southeast NeighborhoodEstimated Value: $445,883 - $525,000
--
Bed
1
Bath
4,156
Sq Ft
$121/Sq Ft
Est. Value
About This Home
This home is located at 2885 Moray Ct, Aurora, IL 60503 and is currently estimated at $500,971, approximately $120 per square foot. 2885 Moray Ct is a home located in Will County with nearby schools including Homestead Elementary School, Murphy Junior High School, and Oswego East High School.
Ownership History
Date
Name
Owned For
Owner Type
Purchase Details
Closed on
Nov 8, 2022
Sold by
Davis Joseph R
Bought by
Joseph R Davis Trust
Current Estimated Value
Purchase Details
Closed on
Mar 24, 2009
Sold by
Davis Joseph R and Davis Betty L
Bought by
The Betty L Davis Trust
Purchase Details
Closed on
Jan 23, 2003
Sold by
American Escrow & Closing Co
Bought by
Davis Joseph R and Davis Betty L
Purchase Details
Closed on
Dec 9, 2002
Sold by
Hale Sherman W and Anne H Hale M
Bought by
American Escrow & Closing Co
Purchase Details
Closed on
Sep 29, 2000
Sold by
Pulte Home Corp
Bought by
Hale Sherman W and Anne H Hale M
Home Financials for this Owner
Home Financials are based on the most recent Mortgage that was taken out on this home.
Original Mortgage
$198,795
Interest Rate
7.99%
Create a Home Valuation Report for This Property
The Home Valuation Report is an in-depth analysis detailing your home's value as well as a comparison with similar homes in the area
Home Values in the Area
Average Home Value in this Area
Purchase History
| Date | Buyer | Sale Price | Title Company |
|---|---|---|---|
| Joseph R Davis Trust | -- | -- | |
| Davis Joseph R | -- | -- | |
| The Betty L Davis Trust | -- | None Available | |
| Davis Joseph R | $275,000 | First American Title | |
| American Escrow & Closing Co | $275,000 | First American Title | |
| Hale Sherman W | $265,500 | First American Title |
Source: Public Records
Mortgage History
| Date | Status | Borrower | Loan Amount |
|---|---|---|---|
| Previous Owner | Hale Sherman W | $198,795 |
Source: Public Records
Tax History Compared to Growth
Tax History
| Year | Tax Paid | Tax Assessment Tax Assessment Total Assessment is a certain percentage of the fair market value that is determined by local assessors to be the total taxable value of land and additions on the property. | Land | Improvement |
|---|---|---|---|---|
| 2023 | $11,492 | $130,603 | $20,547 | $110,056 |
| 2022 | $10,317 | $114,672 | $19,437 | $95,235 |
| 2021 | $10,230 | $109,211 | $18,511 | $90,700 |
| 2020 | $9,786 | $107,481 | $18,218 | $89,263 |
| 2019 | $9,876 | $104,452 | $17,705 | $86,747 |
| 2018 | $9,002 | $93,278 | $17,315 | $75,963 |
| 2017 | $8,838 | $90,870 | $16,868 | $74,002 |
| 2016 | $8,846 | $88,914 | $16,505 | $72,409 |
| 2015 | $9,505 | $85,494 | $15,870 | $69,624 |
| 2014 | $9,505 | $85,100 | $15,870 | $69,230 |
| 2013 | $9,505 | $85,100 | $15,870 | $69,230 |
Source: Public Records
Map
Nearby Homes
- 2665 Tiffany St
- 3147 Cambria Ct Unit 474
- 2136 Colonial St Unit 1
- 1704 Middlebury Dr Unit 302
- 1722 Middlebury Dr Unit 315
- 2675 Dorothy Dr
- 3025 Diane Dr
- 2125 Union Mill Dr Unit 1
- 1480 Bangor Ln Unit 19D
- 2690 Moss Ln
- 2747 Hillsboro Blvd Unit 3
- 1631 Tara Belle Pkwy
- 1323 Middlebury Dr
- 2495 Hafenrichter Rd
- 1660 Normantown Rd Unit 438
- 1435 Bangor Ln
- 2520 Dorothy Dr
- 2753 Lansdale St
- 1420 Bar Harbour Rd
- 2410 Oakfield Ct
- 2885 Moray Ct
- 2875 Moray Ct
- 2915 Moray Ct
- 1900 Capri Dr
- 2935 Moray Ct
- 1910 Capri Dr
- 2890 Moray Ct Unit 5
- 2880 Moray Ct
- 2900 Moray Ct Unit 5
- 2870 Moray Ct
- 2910 Moray Ct
- 1920 Capri Dr Unit 5
- 1889 Capri Dr
- 1897 Capri Dr
- 1881 Capri Dr Unit 5
- 2945 Moray Ct Unit 5
- 2920 Moray Ct
- 1903 Capri Dr
- 1873 Capri Dr
- 1930 Capri Dr