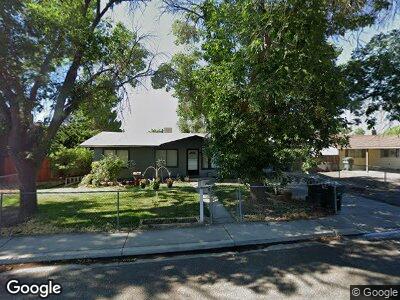
2885 Texas Ave Grand Junction, CO 81501
Downtown Grand Junction NeighborhoodEstimated Value: $268,000 - $300,000
3
Beds
2
Baths
1,008
Sq Ft
$283/Sq Ft
Est. Value
About This Home
This home is located at 2885 Texas Ave, Grand Junction, CO 81501 and is currently estimated at $285,169, approximately $282 per square foot. 2885 Texas Ave is a home located in Mesa County with nearby schools including Nisley Elementary School, Bookcliff Middle School, and Central High School.
Ownership History
Date
Name
Owned For
Owner Type
Purchase Details
Closed on
Aug 6, 1998
Sold by
Bemis Jane L
Bought by
Bilbrey Steven M and Pattison Salina Ann
Current Estimated Value
Home Financials for this Owner
Home Financials are based on the most recent Mortgage that was taken out on this home.
Original Mortgage
$81,268
Outstanding Balance
$20,407
Interest Rate
6.94%
Mortgage Type
FHA
Estimated Equity
$262,918
Purchase Details
Closed on
Nov 14, 1997
Sold by
Benefield Jane L and Benefield Jane L
Bought by
Bemis Jane L
Home Financials for this Owner
Home Financials are based on the most recent Mortgage that was taken out on this home.
Original Mortgage
$58,000
Interest Rate
7.23%
Purchase Details
Closed on
Oct 21, 1997
Sold by
Richard A Benefield Jane L and Richard Janet L
Bought by
Bemis Jane L and Benefield Jane L
Home Financials for this Owner
Home Financials are based on the most recent Mortgage that was taken out on this home.
Original Mortgage
$58,000
Interest Rate
7.23%
Create a Home Valuation Report for This Property
The Home Valuation Report is an in-depth analysis detailing your home's value as well as a comparison with similar homes in the area
Home Values in the Area
Average Home Value in this Area
Purchase History
| Date | Buyer | Sale Price | Title Company |
|---|---|---|---|
| Bilbrey Steven M | $82,000 | First American Title Co | |
| Bemis Jane L | -- | First American Title | |
| Bemis Jane L | -- | -- |
Source: Public Records
Mortgage History
| Date | Status | Borrower | Loan Amount |
|---|---|---|---|
| Open | Bilbrey Steven M | $81,268 | |
| Previous Owner | Bemis Jane L | $58,000 |
Source: Public Records
Tax History Compared to Growth
Tax History
| Year | Tax Paid | Tax Assessment Tax Assessment Total Assessment is a certain percentage of the fair market value that is determined by local assessors to be the total taxable value of land and additions on the property. | Land | Improvement |
|---|---|---|---|---|
| 2024 | $961 | $13,590 | $3,950 | $9,640 |
| 2023 | $961 | $13,590 | $3,950 | $9,640 |
| 2022 | $935 | $12,970 | $3,480 | $9,490 |
| 2021 | $938 | $13,340 | $3,580 | $9,760 |
| 2020 | $631 | $9,190 | $3,220 | $5,970 |
| 2019 | $597 | $9,190 | $3,220 | $5,970 |
| 2018 | $652 | $9,150 | $3,240 | $5,910 |
| 2017 | $650 | $9,150 | $3,240 | $5,910 |
| 2016 | $565 | $8,930 | $3,380 | $5,550 |
| 2015 | $572 | $8,930 | $3,380 | $5,550 |
| 2014 | $478 | $7,520 | $2,790 | $4,730 |
Source: Public Records
Map
Nearby Homes