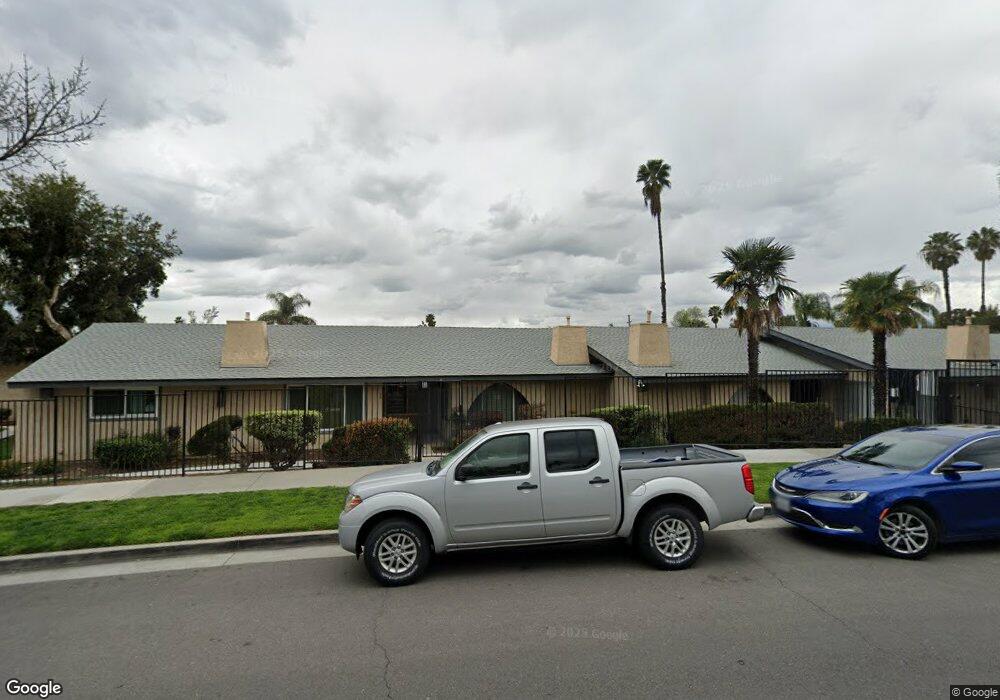
2891 Canyon Crest Dr Unit 20 Riverside, CA 92507
University NeighborhoodEstimated Value: $254,000 - $296,000
About This Home
This home is located at 2891 Canyon Crest Dr Unit 20, Riverside, CA 92507 and is currently estimated at $272,460, approximately $362 per square foot. 2891 Canyon Crest Dr Unit 20 is a home located in Riverside County with nearby schools including Highland Elementary, University Heights Middle School, and John W. North High School.
Ownership History
We collect this data history from publicly available records. To have your information removed, we recommend requesting removal directly through your county’s website.
Purchase Details
Home Financials for this Owner
Home Financials are based on the most recent Mortgage that was taken out on this home.Purchase Details
Home Financials for this Owner
Home Financials are based on the most recent Mortgage that was taken out on this home.Purchase Details
Home Values in the Area
Average Home Value in this Area
Purchase History
We collect this data history from publicly available records. To have your information removed, we recommend requesting removal directly through your county’s website.
| Date | Buyer | Sale Price | Title Company |
|---|---|---|---|
| $74,000 | Old Republic Title Company | ||
| $63,500 | Fidelity National Title Ins | ||
| -- | -- |
Mortgage History
We collect this data history from publicly available records. To have your information removed, we recommend requesting removal directly through your county’s website.
| Date | Status | Borrower | Loan Amount |
|---|---|---|---|
| Open | $72,261 | ||
| Previous Owner | $61,550 |
Tax History
We collect this data history from publicly available records. To have your information removed, we recommend requesting removal directly through your county’s website.
| Year | Tax Paid | Tax Assessment Tax Assessment Total Assessment is a certain percentage of the fair market value that is determined by local assessors to be the total taxable value of land and additions on the property. | Land | Improvement |
|---|---|---|---|---|
| 2025 | $1,206 | $107,144 | $28,949 | $78,195 |
| 2023 | $1,206 | $102,985 | $27,826 | $75,159 |
| 2022 | $1,179 | $100,967 | $27,281 | $73,686 |
| 2021 | $1,179 | $98,989 | $26,747 | $72,242 |
| 2020 | $1,170 | $97,975 | $26,473 | $71,502 |
| 2019 | $1,149 | $96,054 | $25,954 | $70,100 |
| 2018 | $1,128 | $94,172 | $25,446 | $68,726 |
| 2017 | $1,109 | $92,327 | $24,948 | $67,379 |
| 2016 | $1,041 | $90,517 | $24,459 | $66,058 |
| 2015 | $1,026 | $89,160 | $24,093 | $65,067 |
| 2014 | $1,015 | $87,416 | $23,622 | $63,794 |
Map
- 1065 Bascomb Dr
- 775 Huston Dr
- 1164 Massachusetts Ave
- 755 Huston Dr
- 657 Glenhill Dr
- 1110 W Blaine St Unit 102
- 1110 W Blaine St Unit 107
- 2510 Cloudcrest Way
- 1136 W Blaine St Unit 203
- 1305 Massachusetts Ave Unit 205
- 1329 Massachusetts Ave Unit 202
- 1337 Massachusetts Ave Unit 204
- 1390 Clemson Way
- 36 Round Table Dr
- 1333 Wheaton Way
- 104 Sir Tristram Dr Unit 104
- 2530 Thayer Ct
- 1560 Massachusetts Ave
- 1560 Massachusetts Ave Unit 96
- 1560 Massachusetts Ave Unit 94
- 2891 Canyon Crest Dr
- 2891 Canyon Crest Dr
- 2891 Canyon Crest Dr Unit 69
- 2891 Canyon Crest Dr Unit 9
- 2891 Canyon Crest Dr Unit 73
- 2891 Canyon Crest Dr Unit 72
- 2891 Canyon Crest Dr Unit 23
- 2891 Canyon Crest Dr Unit 22
- 2891 Canyon Crest Dr Unit 21
- 2891 Canyon Crest Dr Unit 19
- 2891 Canyon Crest Dr Unit 18
- 2891 Canyon Crest Dr Unit 17
- 2891 Canyon Crest Dr Unit 15
- 2891 Canyon Crest Dr Unit 14
- 2891 Canyon Crest Dr Unit 13
- 2891 Canyon Crest Dr Unit 12
- 2891 Canyon Crest Dr Unit 11
- 2891 Canyon Crest Dr Unit 10
- 2891 Canyon Crest Dr Unit 8
- 2891 Canyon Crest Dr Unit 7
Ask me questions while you tour the home.