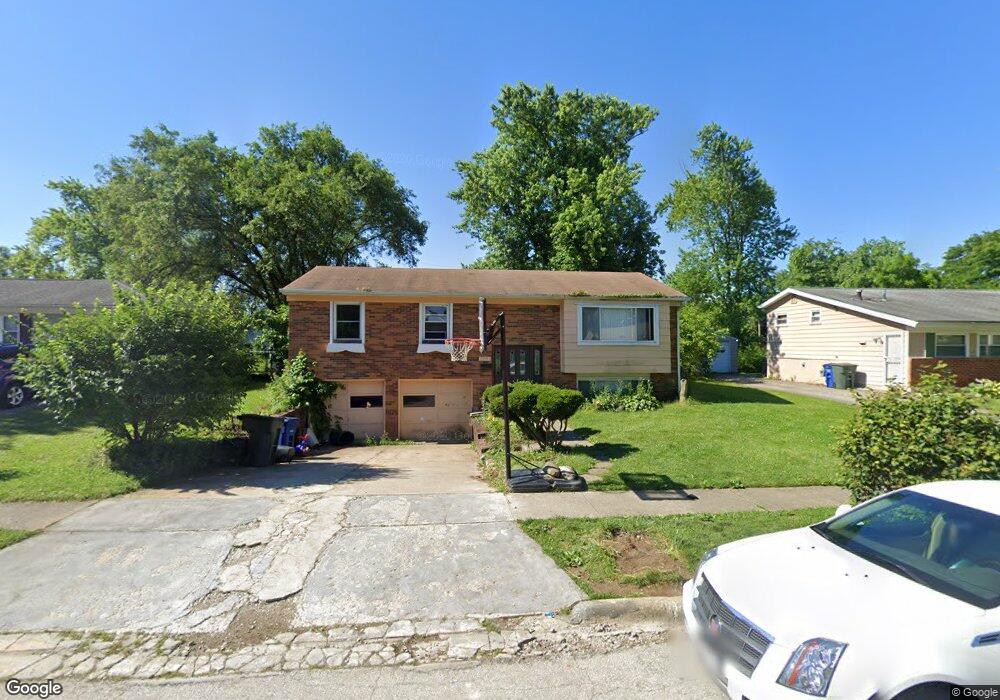
2891 Keystone Dr Columbus, OH 43209
Berwick NeighborhoodEstimated Value: $206,000 - $273,000
4
Beds
2
Baths
1,510
Sq Ft
$156/Sq Ft
Est. Value
About This Home
This home is located at 2891 Keystone Dr, Columbus, OH 43209 and is currently estimated at $236,042, approximately $156 per square foot. 2891 Keystone Dr is a home located in Franklin County with nearby schools including Berwick Alternative K-8 School, Walnut Ridge High School, and Whitehall Preparatory And Fitness Academy.
Ownership History
Date
Name
Owned For
Owner Type
Purchase Details
Closed on
Jul 23, 2016
Sold by
Fayne Yaizmen S and Wallace Yaizmen S
Bought by
Fayne Yaizmen S
Current Estimated Value
Home Financials for this Owner
Home Financials are based on the most recent Mortgage that was taken out on this home.
Original Mortgage
$81,781
Outstanding Balance
$66,036
Interest Rate
4.19%
Mortgage Type
FHA
Estimated Equity
$170,006
Purchase Details
Closed on
Nov 19, 2009
Sold by
Hopkins William G and Hopkins Tracey Percival
Bought by
Wallace Yaizmen S
Home Financials for this Owner
Home Financials are based on the most recent Mortgage that was taken out on this home.
Original Mortgage
$88,369
Interest Rate
5.02%
Mortgage Type
FHA
Purchase Details
Closed on
Dec 22, 2008
Sold by
Us Bank National Association
Bought by
Hopkins William G
Purchase Details
Closed on
Jul 24, 2008
Sold by
Shaw Henry B and Case #07Cve10 14031
Bought by
Us Bank Na and C Bass Mortgage Loan Asset Backed Certif
Purchase Details
Closed on
May 24, 1988
Bought by
Shaw Henry B
Create a Home Valuation Report for This Property
The Home Valuation Report is an in-depth analysis detailing your home's value as well as a comparison with similar homes in the area
Home Values in the Area
Average Home Value in this Area
Purchase History
| Date | Buyer | Sale Price | Title Company |
|---|---|---|---|
| Fayne Yaizmen S | -- | None Available | |
| Wallace Yaizmen S | $90,000 | Tlc Title | |
| Hopkins William G | $26,000 | Attorney | |
| Us Bank Na | $60,000 | None Available | |
| Shaw Henry B | $53,000 | -- |
Source: Public Records
Mortgage History
| Date | Status | Borrower | Loan Amount |
|---|---|---|---|
| Open | Fayne Yaizmen S | $81,781 | |
| Closed | Wallace Yaizmen S | $88,369 |
Source: Public Records
Tax History
| Year | Tax Paid | Tax Assessment Tax Assessment Total Assessment is a certain percentage of the fair market value that is determined by local assessors to be the total taxable value of land and additions on the property. | Land | Improvement |
|---|---|---|---|---|
| 2025 | $3,063 | $68,260 | $14,390 | $53,870 |
| 2024 | $3,063 | $68,260 | $14,390 | $53,870 |
| 2023 | $3,024 | $68,250 | $14,385 | $53,865 |
| 2022 | $1,872 | $36,090 | $8,440 | $27,650 |
| 2021 | $2,077 | $36,090 | $8,440 | $27,650 |
| 2020 | $1,980 | $36,090 | $8,440 | $27,650 |
| 2019 | $1,914 | $29,970 | $7,040 | $22,930 |
| 2018 | $1,702 | $29,970 | $7,040 | $22,930 |
| 2017 | $1,784 | $29,970 | $7,040 | $22,930 |
| 2016 | $1,751 | $26,430 | $5,220 | $21,210 |
| 2015 | $1,589 | $26,430 | $5,220 | $21,210 |
| 2014 | $1,593 | $26,430 | $5,220 | $21,210 |
| 2013 | $872 | $29,330 | $5,775 | $23,555 |
Source: Public Records
Map
Nearby Homes
- 2840 Manola Dr
- 1637 S James Rd
- 1679 Penfield Rd
- 2731 Sonata Dr
- 2639 Halleck Dr
- 2813 Kingsrowe Ct Unit 43
- 1423 Cottingham Ct E
- 1341 Millerdale Rd
- 1884 Barnett Ct W
- 2942 Arrowhead Ct
- 3038 Wadsworth Ct
- 3285 Scottwood Rd
- 3036 Wadsworth Ct
- 3325 E Deshler Ave
- 3328 Penfield Rd
- 2676 Tudor Rd
- 2390 Village at Bexley Dr Unit 2390
- 3428 LIV Moor Dr
- 1353 Barnett Rd
- 2029 Burwell Dr Unit A
- 2899 Keystone Dr
- 2883 Keystone Dr
- 2886 Manola Dr
- 2907 Keystone Dr
- 2875 Keystone Dr
- 2878 Manola Dr
- 2894 Manola Dr
- 2890 Keystone Dr
- 2870 Manola Dr
- 2902 Manola Dr
- 2898 Keystone Dr
- 2886 Keystone Dr
- 2867 Keystone Dr
- 2906 Keystone Dr
- 2878 Keystone Dr
- 2862 Manola Dr
- 2923 Keystone Dr
- 1705 Newfield Rd
- 1713 Newfield Rd
- 2870 Keystone Dr
Your Personal Tour Guide
Ask me questions while you tour the home.