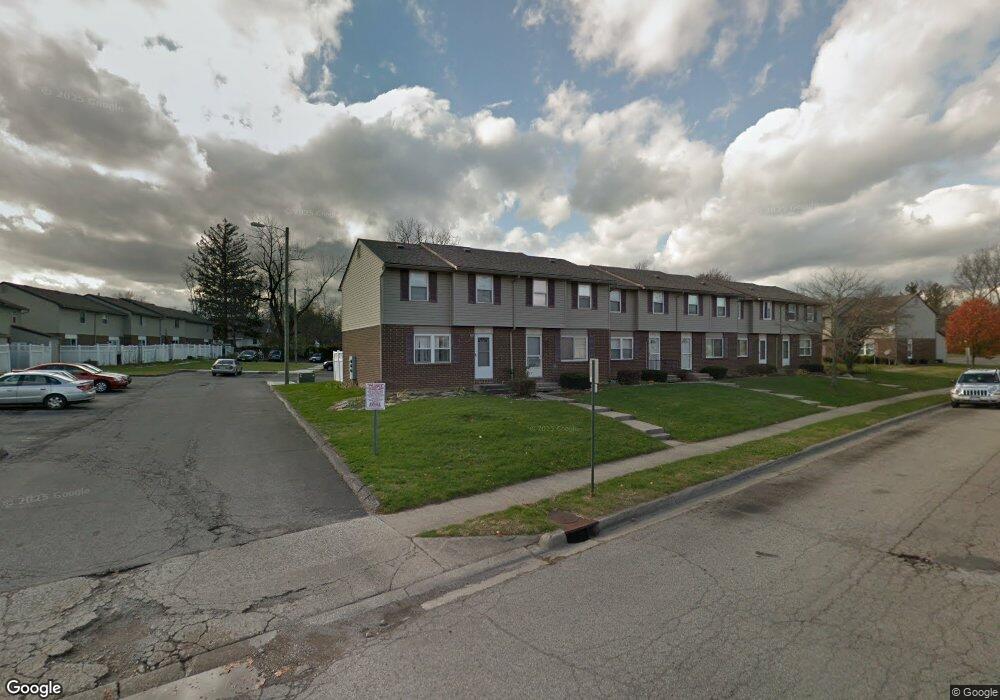
2893 Bridgewalk St Unit 17 Columbus, OH 43224
Framingham NeighborhoodEstimated Value: $81,000 - $96,000
3
Beds
2
Baths
950
Sq Ft
$94/Sq Ft
Est. Value
About This Home
This home is located at 2893 Bridgewalk St Unit 17, Columbus, OH 43224 and is currently estimated at $88,827, approximately $93 per square foot. 2893 Bridgewalk St Unit 17 is a home located in Franklin County with nearby schools including East Linden Elementary School, Mifflin Middle School, and Mifflin High School.
Ownership History
Date
Name
Owned For
Owner Type
Purchase Details
Closed on
Apr 30, 2007
Sold by
Truong Van T and Le Hung Minh
Bought by
Asamoah Samuel K
Current Estimated Value
Home Financials for this Owner
Home Financials are based on the most recent Mortgage that was taken out on this home.
Original Mortgage
$35,000
Outstanding Balance
$21,324
Interest Rate
6.2%
Mortgage Type
Purchase Money Mortgage
Estimated Equity
$67,503
Purchase Details
Closed on
Sep 28, 2005
Sold by
Levitski Grigori D and Levitski Irena
Bought by
Truong Van T
Purchase Details
Closed on
Aug 22, 2005
Sold by
Hines Mellany M and Key Bank Usa Na
Bought by
Levitski Grigori D
Purchase Details
Closed on
Oct 30, 1995
Sold by
Capital City Community U
Bought by
Mellany M Hines
Home Financials for this Owner
Home Financials are based on the most recent Mortgage that was taken out on this home.
Original Mortgage
$27,000
Interest Rate
8.25%
Mortgage Type
New Conventional
Create a Home Valuation Report for This Property
The Home Valuation Report is an in-depth analysis detailing your home's value as well as a comparison with similar homes in the area
Home Values in the Area
Average Home Value in this Area
Purchase History
| Date | Buyer | Sale Price | Title Company |
|---|---|---|---|
| Asamoah Samuel K | $35,000 | Amerititle | |
| Truong Van T | $33,000 | Amerititle | |
| Levitski Grigori D | $22,500 | -- | |
| Mellany M Hines | $28,500 | -- |
Source: Public Records
Mortgage History
| Date | Status | Borrower | Loan Amount |
|---|---|---|---|
| Open | Asamoah Samuel K | $35,000 | |
| Previous Owner | Mellany M Hines | $27,000 |
Source: Public Records
Tax History Compared to Growth
Tax History
| Year | Tax Paid | Tax Assessment Tax Assessment Total Assessment is a certain percentage of the fair market value that is determined by local assessors to be the total taxable value of land and additions on the property. | Land | Improvement |
|---|---|---|---|---|
| 2024 | $1,186 | $26,430 | $2,800 | $23,630 |
| 2023 | $1,171 | $26,430 | $2,800 | $23,630 |
| 2022 | $786 | $15,160 | $1,680 | $13,480 |
| 2021 | $788 | $15,160 | $1,680 | $13,480 |
| 2020 | $789 | $15,160 | $1,680 | $13,480 |
| 2019 | $767 | $12,640 | $1,400 | $11,240 |
| 2018 | $748 | $12,640 | $1,400 | $11,240 |
| 2017 | $766 | $12,640 | $1,400 | $11,240 |
| 2016 | $805 | $12,150 | $2,100 | $10,050 |
| 2015 | $731 | $12,150 | $2,100 | $10,050 |
| 2014 | $732 | $12,150 | $2,100 | $10,050 |
| 2013 | $722 | $12,145 | $2,100 | $10,045 |
Source: Public Records
Map
Nearby Homes
- 2559 Milford Ave
- 0 Club House Dr
- 2683 Club House Dr
- 2858 Woodland Ave
- 2210 Agler Rd
- 2810 Baughman Ave
- 2503 Hingham Ln
- 3781 Aberdeen Ave
- 3775 Aberdeen Ave
- 2621 Ipswick Cir
- 2781 Innis Rd Unit C
- 2781 Innis Rd Unit F
- 2585 Perdue Ave
- 2536 Sunbury Dr
- 2076 Agler Rd
- 3286 Framington Dr
- 2386 Century Dr
- 3137 Westerville Rd Unit 44
- 3137 Westerville Rd Unit 91
- 2096 Minnesota Ave
- 2895 Bridgewalk St
- 2897 Bridgewalk St
- 2899 Bridgewalk St
- 2901 Bridgewalk St
- 2903 Bridgewalk St
- 2915 Bridgewalk St
- 2905 Bridgewalk St
- 2913 Bridgewalk St
- 2907 Bridgewalk St
- 2480 Agler Rd Unit 2480
- 2486 Agler Rd
- 2911 Bridgewalk St
- 2484 Agler Rd Unit 2484
- 2478 Agler Rd
- 2909 Bridgewalk St Unit 2909
- 2482 Agler Rd
- 2890 Bridgewalk St
- 2472 Agler Rd Unit 2472
- 2476 Agler Rd Unit 2476
- 2929 Bridgewalk St Unit 2929