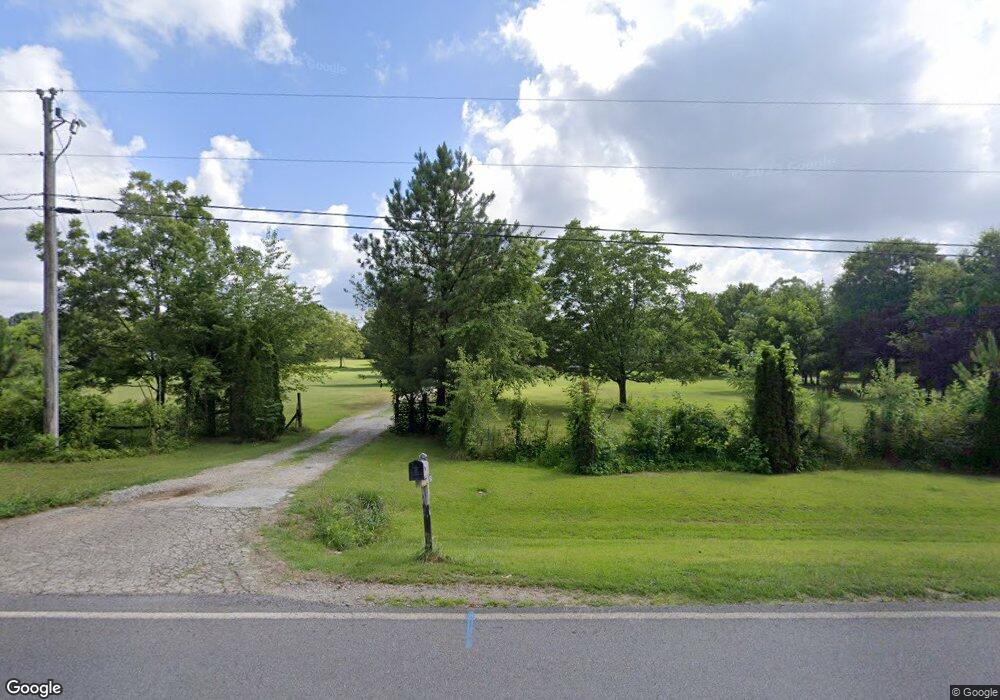
2895 Partain Rd NW Monroe, GA 30656
Estimated Value: $396,000 - $453,483
--
Bed
--
Bath
1,972
Sq Ft
$219/Sq Ft
Est. Value
About This Home
This home is located at 2895 Partain Rd NW, Monroe, GA 30656 and is currently estimated at $431,621, approximately $218 per square foot. 2895 Partain Rd NW is a home located in Walton County with nearby schools including Monroe Elementary School, Carver Middle School, and Monroe Area High School.
Ownership History
Date
Name
Owned For
Owner Type
Purchase Details
Closed on
Jul 20, 2006
Sold by
Xiong Dang and Xiong Youa
Bought by
Xiong Dang and Xiong Youa
Current Estimated Value
Home Financials for this Owner
Home Financials are based on the most recent Mortgage that was taken out on this home.
Original Mortgage
$195,200
Outstanding Balance
$116,077
Interest Rate
6.68%
Mortgage Type
New Conventional
Estimated Equity
$315,544
Purchase Details
Closed on
Jul 26, 2002
Sold by
Centex Homes
Bought by
Xiong Dang and Xiong Youa
Home Financials for this Owner
Home Financials are based on the most recent Mortgage that was taken out on this home.
Original Mortgage
$166,000
Interest Rate
6.62%
Mortgage Type
New Conventional
Purchase Details
Closed on
Aug 27, 1999
Sold by
Hunter Richard P and Hunter Elizabeth A
Bought by
Willis Ralph
Home Financials for this Owner
Home Financials are based on the most recent Mortgage that was taken out on this home.
Original Mortgage
$163,012
Interest Rate
7.5%
Mortgage Type
New Conventional
Create a Home Valuation Report for This Property
The Home Valuation Report is an in-depth analysis detailing your home's value as well as a comparison with similar homes in the area
Home Values in the Area
Average Home Value in this Area
Purchase History
| Date | Buyer | Sale Price | Title Company |
|---|---|---|---|
| Xiong Dang | -- | -- | |
| Xiong Dang | $175,000 | -- | |
| Willis Ralph | $181,200 | -- |
Source: Public Records
Mortgage History
| Date | Status | Borrower | Loan Amount |
|---|---|---|---|
| Open | Xiong Dang | $195,200 | |
| Previous Owner | Xiong Dang | $166,000 | |
| Previous Owner | Willis Ralph | $163,012 |
Source: Public Records
Tax History Compared to Growth
Tax History
| Year | Tax Paid | Tax Assessment Tax Assessment Total Assessment is a certain percentage of the fair market value that is determined by local assessors to be the total taxable value of land and additions on the property. | Land | Improvement |
|---|---|---|---|---|
| 2024 | $4,769 | $161,760 | $46,600 | $115,160 |
| 2023 | $4,608 | $151,920 | $44,200 | $107,720 |
| 2022 | $4,310 | $136,320 | $39,880 | $96,440 |
| 2021 | $3,472 | $106,560 | $31,000 | $75,560 |
| 2020 | $3,328 | $99,600 | $26,880 | $72,720 |
| 2019 | $3,120 | $89,760 | $23,880 | $65,880 |
| 2018 | $3,002 | $89,760 | $23,880 | $65,880 |
| 2017 | $3,029 | $87,920 | $23,880 | $64,040 |
| 2016 | $2,439 | $71,840 | $17,840 | $54,000 |
| 2015 | $2,389 | $69,240 | $17,800 | $51,440 |
| 2014 | $2,116 | $59,800 | $0 | $0 |
Source: Public Records
Map
Nearby Homes
- 2796 Barbon Rd
- 2112 Perry Place Ln
- 753 Belle Vista St
- 757 Belle Vista St
- 744 Belle Vista St
- 3300 Jack Glass Rd
- 553 Belle Woode St
- 733 Belle Vista St
- 724 Belle Vista St
- 548 Belle Woode St
- 729 Belle Vista St
- 2321 Broach Rd NW
- (GA)The Ava | Front Entry Plan at Belle Woode Estates
- (GA)The Avondale | Front Entry Plan at Belle Woode Estates
- (GA)The Ellen | Front Entry Plan at Belle Woode Estates
- (GA)The Carson | Front Entry Plan at Belle Woode Estates
- (GA)The Everett | Front Entry Plan at Belle Woode Estates
- (GA)The Emerson Ranch | Front Entry Plan at Belle Woode Estates
- 2897 Partain Rd NW
- 2891 Partain Rd NW
- 2899 Partain Rd NW
- 2905 Partain Rd NW
- 2889 Partain Rd NW
- 2880 Partain Rd NW
- 2885 Partain Rd NW
- 2810 Shoal Creek Rd NW
- 2874 Partain Rd NW
- 2900 Shoal Creek Rd
- 2879 Partain Rd NW
- 2874 Jack Glass Rd
- 2875 Partain Rd NW
- 2800 Shoal Creek Rd
- 2894 Partain Rd NW
- 2854 Jack Glass Rd
- 2844 Jack Glass Rd
- 2889 Shoal Creek Rd
- 2884 Jack Glass Rd
- 2840 Jack Glass Rd