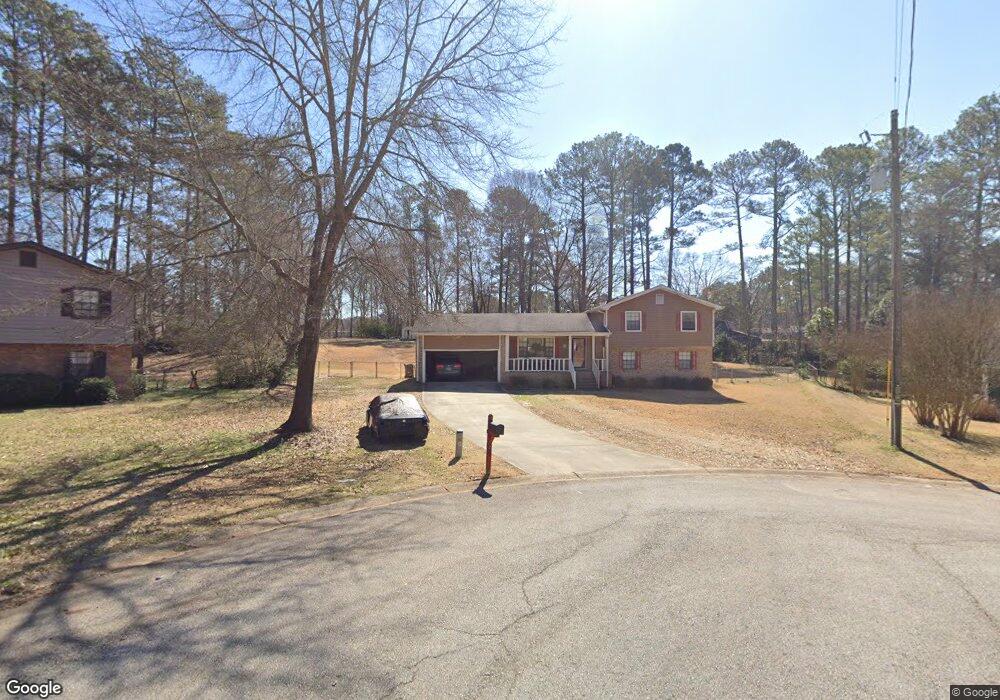
29 Carriage Ct Unit 2 Stockbridge, GA 30281
Estimated Value: $222,251 - $258,000
3
Beds
2
Baths
1,798
Sq Ft
$132/Sq Ft
Est. Value
About This Home
This home is located at 29 Carriage Ct Unit 2, Stockbridge, GA 30281 and is currently estimated at $237,313, approximately $131 per square foot. 29 Carriage Ct Unit 2 is a home located in Henry County with nearby schools including Cotton Indian Elementary School, Stockbridge Middle School, and Stockbridge High School.
Ownership History
Date
Name
Owned For
Owner Type
Purchase Details
Closed on
May 5, 2018
Sold by
Thongsy Kong
Bought by
Thongsy Kong and Siriphongsavath Ammaly
Current Estimated Value
Home Financials for this Owner
Home Financials are based on the most recent Mortgage that was taken out on this home.
Original Mortgage
$60,000
Outstanding Balance
$51,551
Interest Rate
4.4%
Mortgage Type
New Conventional
Estimated Equity
$185,762
Purchase Details
Closed on
May 4, 2018
Sold by
Siriphongsavath Chathappho
Bought by
Thongsy Kong
Home Financials for this Owner
Home Financials are based on the most recent Mortgage that was taken out on this home.
Original Mortgage
$60,000
Outstanding Balance
$51,551
Interest Rate
4.4%
Mortgage Type
New Conventional
Estimated Equity
$185,762
Purchase Details
Closed on
May 18, 1999
Sold by
Bentley Susan D
Bought by
Siriphongsavath Chanthaph
Home Financials for this Owner
Home Financials are based on the most recent Mortgage that was taken out on this home.
Original Mortgage
$100,850
Interest Rate
6.87%
Mortgage Type
New Conventional
Create a Home Valuation Report for This Property
The Home Valuation Report is an in-depth analysis detailing your home's value as well as a comparison with similar homes in the area
Home Values in the Area
Average Home Value in this Area
Purchase History
| Date | Buyer | Sale Price | Title Company |
|---|---|---|---|
| Thongsy Kong | -- | -- | |
| Thongsy Kong | -- | -- | |
| Siriphongsavath Chanthaph | $104,000 | -- |
Source: Public Records
Mortgage History
| Date | Status | Borrower | Loan Amount |
|---|---|---|---|
| Open | Thongsy Kong | $60,000 | |
| Previous Owner | Siriphongsavath Chanthaph | $100,850 |
Source: Public Records
Tax History Compared to Growth
Tax History
| Year | Tax Paid | Tax Assessment Tax Assessment Total Assessment is a certain percentage of the fair market value that is determined by local assessors to be the total taxable value of land and additions on the property. | Land | Improvement |
|---|---|---|---|---|
| 2025 | $2,726 | $98,280 | $14,000 | $84,280 |
| 2024 | $2,726 | $86,320 | $14,000 | $72,320 |
| 2023 | $2,025 | $86,640 | $14,000 | $72,640 |
| 2022 | $2,217 | $73,400 | $10,000 | $63,400 |
| 2021 | $1,833 | $57,160 | $10,000 | $47,160 |
| 2020 | $1,700 | $51,520 | $8,000 | $43,520 |
| 2019 | $1,555 | $46,560 | $8,000 | $38,560 |
| 2018 | $1,362 | $41,520 | $8,000 | $33,520 |
| 2016 | $1,368 | $41,680 | $6,000 | $35,680 |
| 2015 | $1,104 | $34,200 | $6,000 | $28,200 |
| 2014 | $983 | $30,920 | $4,800 | $26,120 |
Source: Public Records
Map
Nearby Homes
- 20 Carriage Trace
- 0 E Atlanta Rd Unit @VALERIE CT 10464740
- 0 E Atlanta Rd Unit @KINSEY DR 10464743
- 20 Lamp Post Ct
- 230 Carriage Cir
- 90 Country Roads Dr
- 230 Flintlock Trail
- 905 E Atlanta Rd
- 219 Thorncrest
- 393 Young James Cir
- 0 Stagecoach Rd Unit 20.17 ACRES 10455441
- 389 Young James Cir
- 20 King Place
- 453 Azalea Dr
- 1773 E Atlanta Rd
- 418 Honeysuckle Ln
- 145 Glenloch Pkwy
- 7031 Coatsworth Dr Unit 2
- 491 Thurman Rd Unit TRACT C
- 270 Mays Rd
- 27 Carriage Ct Unit 2
- 30 Carriage Trace
- 31 Carriage Ct
- 40 Carriage Trace
- 33 Carriage Ct Unit 2
- 15 Carriage Cir
- 15 Carriage Cir Unit 67
- 35 Carriage Ct
- 0 Carriage Trace Unit 8482846
- 0 Carriage Trace Unit 7531205
- 0 Carriage Trace Unit 8656078
- 0 Carriage Trace Unit 8963452
- 0 Carriage Trace Unit 9014761
- 0 Carriage Trace Unit 8640677
- 0 Carriage Trace Unit 8798654
- 0 Carriage Trace
- 10 Carriage Trace
- 60 Carriage Trace
- 45 Carriage Cir
- 5 Carriage Cir Unit 2