
Seller's Agent in 2025
Megan Bixler
Alta Realty Group CA, Inc
(949) 282-0088
1 in this area
58 Total Sales
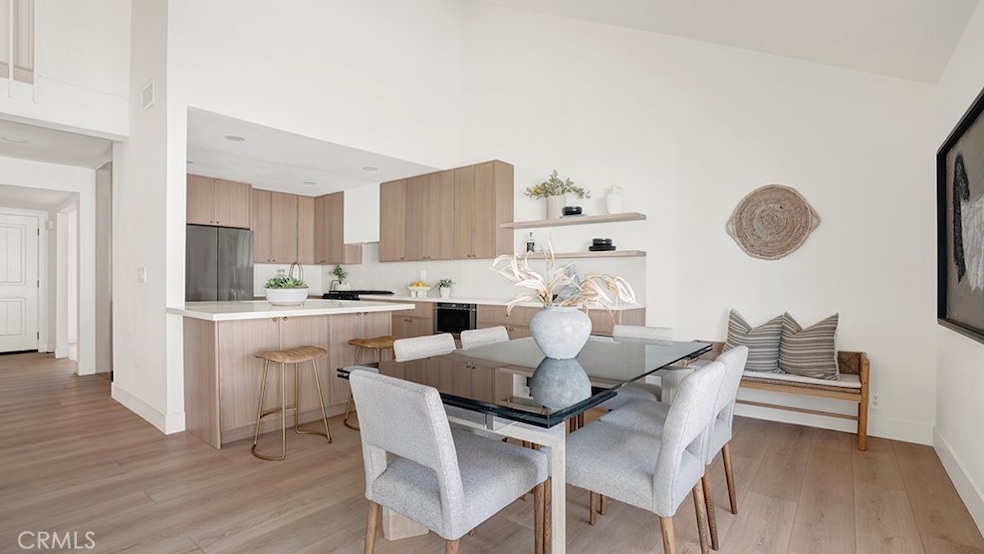
Welcome to a thoughtfully reimagined Irvine home framed by lush new landscaping and an
inviting courtyard. Step inside to white-oak luxury vinyl plank flooring, LED recessed lighting,
new baseboards and casings throughout. The heart of the home is a warm, plaster-finished
wood-burning fireplace that anchors the open living space. A designer kitchen showcases slim
oak-shaker cabinetry, quartz countertops, a tile backsplash, quartz sink, champagne-bronze
fixtures, and a suite of new appliances including a bespoke range, dishwasher, and
over-the-range microwave. Dual-pane windows and new sliding doors invite easy
indoor-outdoor living to a fully refreshed backyard with new concrete patio and vinyl
fencing—perfect for gatherings. Guest bedrooms feature upgraded lighting and closet systems;
the hall bath includes an oversized soaking tub and tiled shower niche. The spacious primary
suite adds a double vanity, designer tile, and crystal-clear Starphire shower glass for a spa-like
feel. Modern touches include matte-black hardware with solid-core doors, new outlets/switches,
a smart thermostat with tuned-up HVAC, epoxy-finished garage with new door motor/keypad,
and a 200-amp electrical panel. Turnkey and move-in ready.
Last Agent to Sell the Property
Alta Realty Group CA, Inc Brokerage Phone: 949-698-3901 License #01433347 Listed on: 09/09/2025
| Date | Type | Sale Price | Title Company |
|---|---|---|---|
| Grant Deed | $1,905,000 | First American Title Company | |
| Grant Deed | $1,450,000 | First American Title Company | |
| Quit Claim Deed | -- | First American Title Company | |
| Interfamily Deed Transfer | -- | None Available | |
| Interfamily Deed Transfer | -- | None Available | |
| Interfamily Deed Transfer | -- | None Available | |
| Interfamily Deed Transfer | -- | -- |
| Date | Status | Loan Amount | Loan Type |
|---|---|---|---|
| Previous Owner | $1,600,000 | New Conventional |
| Date | Event | Price | List to Sale | Price per Sq Ft |
|---|---|---|---|---|
| 11/21/2025 11/21/25 | Sold | $1,905,000 | -4.2% | $903 / Sq Ft |
| 11/17/2025 11/17/25 | For Sale | $1,988,000 | +4.4% | $943 / Sq Ft |
| 11/16/2025 11/16/25 | Off Market | $1,905,000 | -- | -- |
| 11/01/2025 11/01/25 | Pending | -- | -- | -- |
| 09/18/2025 09/18/25 | Price Changed | $1,988,000 | 0.0% | $943 / Sq Ft |
| 09/18/2025 09/18/25 | For Sale | $1,988,000 | +4.4% | $943 / Sq Ft |
| 09/15/2025 09/15/25 | Off Market | $1,905,000 | -- | -- |
| 09/09/2025 09/09/25 | For Sale | $1,898,000 | -- | $900 / Sq Ft |
| Year | Tax Paid | Tax Assessment Tax Assessment Total Assessment is a certain percentage of the fair market value that is determined by local assessors to be the total taxable value of land and additions on the property. | Land | Improvement |
|---|---|---|---|---|
| 2025 | $3,937 | $373,250 | $138,296 | $234,954 |
| 2024 | $3,937 | $365,932 | $135,584 | $230,348 |
| 2023 | $3,834 | $358,757 | $132,925 | $225,832 |
| 2022 | $3,755 | $351,723 | $130,319 | $221,404 |
| 2021 | $3,666 | $344,827 | $127,764 | $217,063 |
| 2020 | $3,644 | $341,292 | $126,454 | $214,838 |
| 2019 | $3,562 | $334,600 | $123,974 | $210,626 |
| 2018 | $3,497 | $328,040 | $121,543 | $206,497 |
| 2017 | $3,423 | $321,608 | $119,159 | $202,449 |
| 2016 | $3,274 | $315,302 | $116,822 | $198,480 |
| 2015 | $3,225 | $310,566 | $115,067 | $195,499 |
| 2014 | $3,162 | $304,483 | $112,813 | $191,670 |
Seller's Agent in 2025
Megan Bixler
Alta Realty Group CA, Inc
(949) 282-0088
1 in this area
58 Total Sales
Buyer's Agent in 2025
Shirley Juan Hou
Real Brokerage Technologies, Inc
(626) 991-8577
1 in this area
41 Total Sales
X
Buyer Co-Listing Agent in 2025
Xiang Deng
Pinnacle Real Estate Group
(626) 991-8433
1 in this area
3 Total Sales
Source: California Regional Multiple Listing Service (CRMLS)
MLS Number: OC25206733
APN: 529-153-04
Disclaimer: Certain information contained herein is derived from information provided by parties other than Homes.com. All information provided is deemed reliable, but is not guaranteed to be accurate and should be independently verified.
![]() The multiple listing data appearing on this website, or contained in reports produced therefrom, is owned and copyrighted by California Regional Multiple Listing Service, Inc. ("CRMLS") and is protected by all applicable copyright laws. Information provided is for viewer's personal, non-commercial use and may not be used for any purpose other than to identify prospective properties the viewer may be interested in purchasing. All listing data, including but not limited to square footage and lot size is believed to be accurate, but the listing Agent, listing Broker and CRMLS and its affiliates do not warrant or guarantee such accuracy. The viewer should independently verify the listed data prior to making any decisions based on such information by personal inspection and/or contacting a real estate professional.
The multiple listing data appearing on this website, or contained in reports produced therefrom, is owned and copyrighted by California Regional Multiple Listing Service, Inc. ("CRMLS") and is protected by all applicable copyright laws. Information provided is for viewer's personal, non-commercial use and may not be used for any purpose other than to identify prospective properties the viewer may be interested in purchasing. All listing data, including but not limited to square footage and lot size is believed to be accurate, but the listing Agent, listing Broker and CRMLS and its affiliates do not warrant or guarantee such accuracy. The viewer should independently verify the listed data prior to making any decisions based on such information by personal inspection and/or contacting a real estate professional.
Based on information from California Regional Multiple Listing Service, Inc. and /or other sources. All data, including all measurements and calculations of area, is obtained from various sources and has not been, and will not be, verified by broker or MLS. All information should be independently reviewed and verified for accuracy. Properties may or may not be listed by the office/agent presenting the information
Ask me questions while you tour the home.