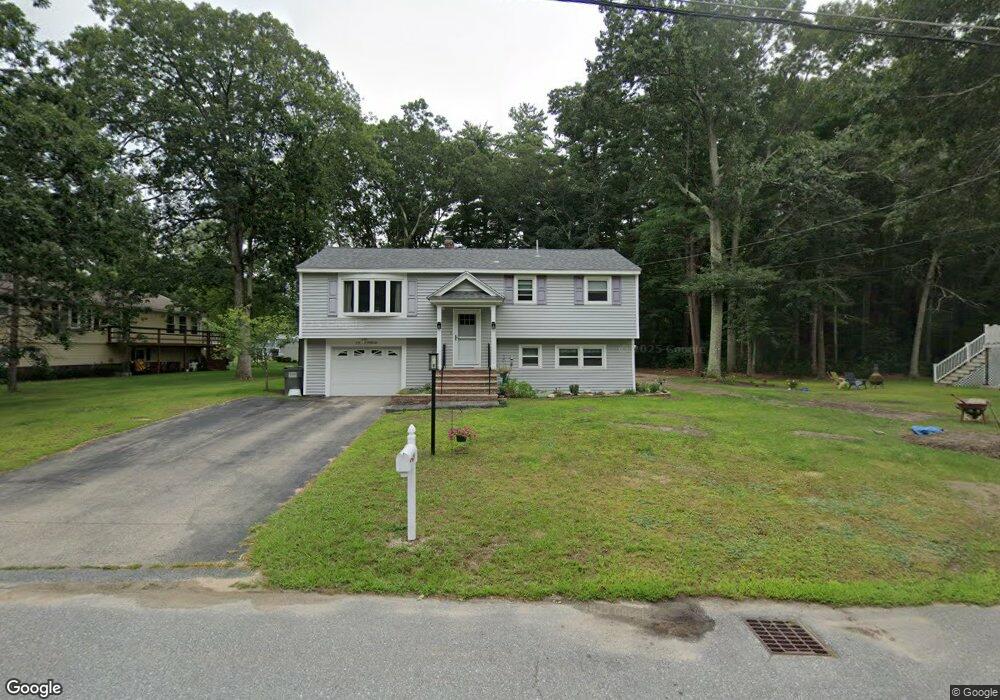
29 Cypress St Salem, NH 03079
Millville NeighborhoodEstimated Value: $570,724 - $646,000
3
Beds
2
Baths
1,445
Sq Ft
$414/Sq Ft
Est. Value
About This Home
This home is located at 29 Cypress St, Salem, NH 03079 and is currently estimated at $597,931, approximately $413 per square foot. 29 Cypress St is a home located in Rockingham County with nearby schools including William T. Barron Elementary School, Woodbury School, and Salem High School.
Ownership History
Date
Name
Owned For
Owner Type
Purchase Details
Closed on
Sep 12, 2019
Sold by
Jm Ulbin Ft
Bought by
Ulbin Jeffrey M and Ulbin Karen J
Current Estimated Value
Home Financials for this Owner
Home Financials are based on the most recent Mortgage that was taken out on this home.
Original Mortgage
$190,000
Outstanding Balance
$166,765
Interest Rate
3.7%
Mortgage Type
New Conventional
Estimated Equity
$431,166
Purchase Details
Closed on
Oct 23, 2012
Sold by
Jacqueline M Ulbin Ret
Bought by
Ulbin Jacqueline M
Purchase Details
Closed on
Apr 9, 1973
Bought by
Jm Ulbin Ft
Create a Home Valuation Report for This Property
The Home Valuation Report is an in-depth analysis detailing your home's value as well as a comparison with similar homes in the area
Home Values in the Area
Average Home Value in this Area
Purchase History
| Date | Buyer | Sale Price | Title Company |
|---|---|---|---|
| Ulbin Jeffrey M | $320,000 | -- | |
| Ulbin Jacqueline M | -- | -- | |
| Jm Ulbin Ft | -- | -- |
Source: Public Records
Mortgage History
| Date | Status | Borrower | Loan Amount |
|---|---|---|---|
| Open | Ulbin Jeffrey M | $190,000 |
Source: Public Records
Tax History Compared to Growth
Tax History
| Year | Tax Paid | Tax Assessment Tax Assessment Total Assessment is a certain percentage of the fair market value that is determined by local assessors to be the total taxable value of land and additions on the property. | Land | Improvement |
|---|---|---|---|---|
| 2024 | $7,315 | $415,600 | $161,600 | $254,000 |
| 2023 | $7,049 | $415,600 | $161,600 | $254,000 |
| 2022 | $6,670 | $415,600 | $161,600 | $254,000 |
| 2021 | $6,641 | $415,600 | $161,600 | $254,000 |
| 2020 | $5,989 | $272,000 | $115,500 | $156,500 |
| 2019 | $5,979 | $272,000 | $115,500 | $156,500 |
| 2018 | $5,878 | $272,000 | $115,500 | $156,500 |
| 2017 | $5,744 | $275,600 | $115,500 | $160,100 |
| 2016 | $5,631 | $275,600 | $115,500 | $160,100 |
| 2015 | $5,358 | $250,500 | $118,100 | $132,400 |
| 2014 | $5,208 | $250,500 | $118,100 | $132,400 |
| 2013 | $5,125 | $250,500 | $118,100 | $132,400 |
Source: Public Records
Map
Nearby Homes
- 4 Mulberry Rd
- 59 Cluff Rd Unit 50
- 59 Cluff Rd Unit 7
- 59 Cluff Rd Unit 41
- 15 Linwood Ave
- 8 Senter St
- 30 Hagop Rd
- 11 Tiffany Rd Unit 1
- 12 Braemoor Woods Rd Unit 206
- 17 Meredith Rd
- 6 Lancelot Ct Unit 2
- 117 Cluff Crossing Rd Unit 7
- 10 Evelyn Rd
- 35 Fraser Dr
- 11 Maclarnon Rd
- 2 Renaissance Cir
- 10 Brady Ave
- 55 Crestwood Cir
- 146 S Policy St
- 48 Pond St