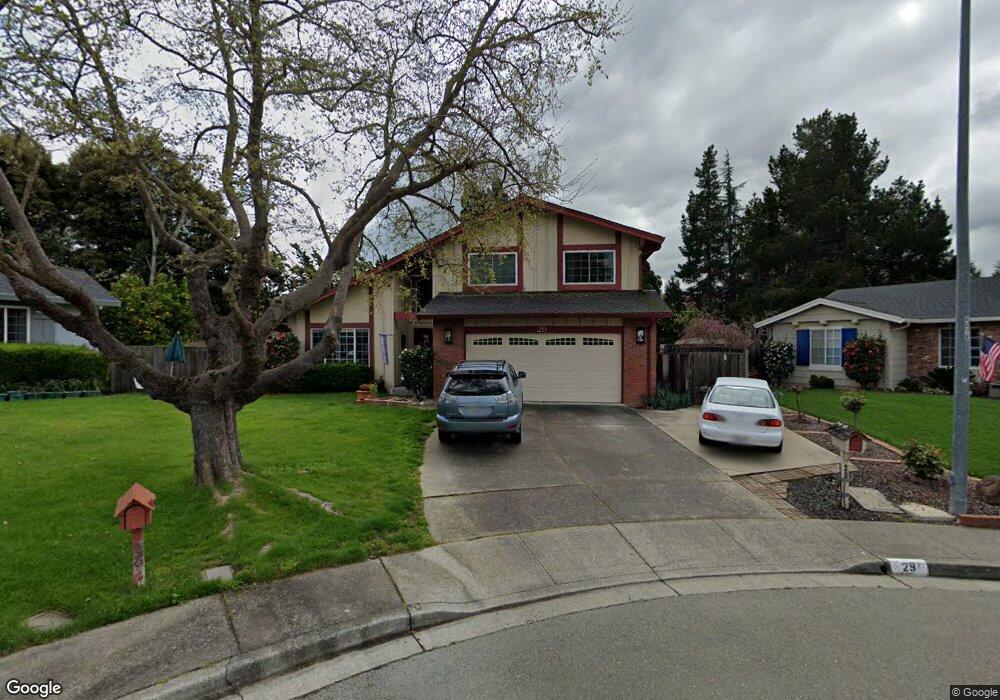
29 Davalos Ct San Ramon, CA 94583
Twin Creeks NeighborhoodEstimated Value: $1,459,000 - $1,692,740
3
Beds
3
Baths
2,029
Sq Ft
$786/Sq Ft
Est. Value
About This Home
This home is located at 29 Davalos Ct, San Ramon, CA 94583 and is currently estimated at $1,594,435, approximately $785 per square foot. 29 Davalos Ct is a home located in Contra Costa County with nearby schools including Bollinger Canyon Elementary School, Iron Horse Middle School, and California High School.
Ownership History
Date
Name
Owned For
Owner Type
Purchase Details
Closed on
Jun 8, 2021
Sold by
Watkin Stephen D and Watkin Julie P
Bought by
Watkin Stephen D and Watkin Julie P
Current Estimated Value
Purchase Details
Closed on
Jan 14, 1999
Sold by
Thouin Yeung Korrinne R and Keung Shu Y
Bought by
Watkin Stephen D and Watkin Julie P
Home Financials for this Owner
Home Financials are based on the most recent Mortgage that was taken out on this home.
Original Mortgage
$298,800
Outstanding Balance
$47,630
Interest Rate
2.95%
Mortgage Type
Purchase Money Mortgage
Estimated Equity
$1,546,805
Purchase Details
Closed on
Dec 15, 1998
Sold by
Yeung Wor Foon
Bought by
Yeung Shu Keung and Thouin Yeung Korrinne R
Home Financials for this Owner
Home Financials are based on the most recent Mortgage that was taken out on this home.
Original Mortgage
$298,800
Outstanding Balance
$47,630
Interest Rate
2.95%
Mortgage Type
Purchase Money Mortgage
Estimated Equity
$1,546,805
Create a Home Valuation Report for This Property
The Home Valuation Report is an in-depth analysis detailing your home's value as well as a comparison with similar homes in the area
Home Values in the Area
Average Home Value in this Area
Purchase History
| Date | Buyer | Sale Price | Title Company |
|---|---|---|---|
| Watkin Stephen D | -- | None Available | |
| Watkin Stephen D | $373,500 | North American Title Co | |
| Yeung Shu Keung | -- | -- |
Source: Public Records
Mortgage History
| Date | Status | Borrower | Loan Amount |
|---|---|---|---|
| Open | Watkin Stephen D | $298,800 |
Source: Public Records
Tax History Compared to Growth
Tax History
| Year | Tax Paid | Tax Assessment Tax Assessment Total Assessment is a certain percentage of the fair market value that is determined by local assessors to be the total taxable value of land and additions on the property. | Land | Improvement |
|---|---|---|---|---|
| 2025 | $7,612 | $619,174 | $376,240 | $242,934 |
| 2024 | $7,483 | $607,034 | $368,863 | $238,171 |
| 2023 | $7,483 | $595,132 | $361,631 | $233,501 |
| 2022 | $7,427 | $583,464 | $354,541 | $228,923 |
| 2021 | $7,263 | $572,025 | $347,590 | $224,435 |
| 2019 | $7,093 | $555,060 | $337,281 | $217,779 |
| 2018 | $6,830 | $544,177 | $330,668 | $213,509 |
| 2017 | $6,266 | $504,508 | $324,185 | $180,323 |
| 2016 | $6,175 | $494,617 | $317,829 | $176,788 |
| 2015 | $6,086 | $487,188 | $313,055 | $174,133 |
| 2014 | $5,994 | $477,645 | $306,923 | $170,722 |
Source: Public Records
Map
Nearby Homes
- 600 Guaymas Ct
- 2632 Campeche Ct
- 2720 Marsh Dr
- Plan 3 at City Village - The Courts
- Plan 3 at City Village - The Towns
- Plan 1 at City Village - The Courts
- Plan 1 at City Village - The Towns
- Plan 3X at City Village - The Courts
- Plan 1X at City Village - The Courts
- Plan 2 at City Village - The Towns
- Plan 1 at City Village - The Rows
- Plan 4 at City Village - The Towns
- Plan 2 at City Village - The Rows
- Plan 2 at City Village - The Courts
- Plan 3 at City Village - The Rows
- 205 Compton Cir Unit B
- 560 La Copita Ct
- 2482 Wildhorse Dr
- 44 Dos Rios Ct
- 412 Carillo Ct
- 25 Davalos Ct
- 28 Davalos Ct
- 66 Mesa Vista Ct
- 67 Mesa Vista Ct
- 24 Davalos Ct
- 18 Ferrol Ct
- 513 Santander Dr
- 19 Ferrol Ct
- 62 Mesa Vista Ct
- 509 Santander Dr
- 519 Santander Dr
- 63 Mesa Vista Ct
- 505 Santander Dr
- 45 Cuenca Ct
- 58 Mesa Vista Ct
- 499 Santander Dr
- 491 Santander Dr
- 59 Mesa Vista Ct
- 62 Arenas Ct
- 49 Cuenca Ct