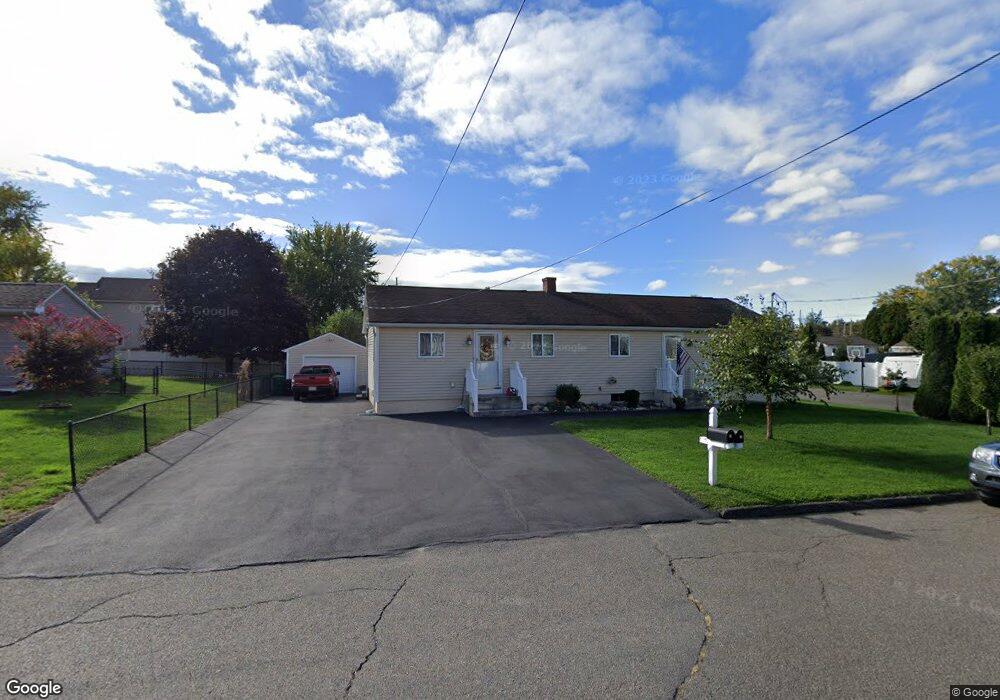
29 Foss Ave Chicopee, MA 01013
Willimansett NeighborhoodEstimated Value: $113,000 - $347,000
2
Beds
1
Bath
800
Sq Ft
$328/Sq Ft
Est. Value
About This Home
This home is located at 29 Foss Ave, Chicopee, MA 01013 and is currently estimated at $262,230, approximately $327 per square foot. 29 Foss Ave is a home located in Hampden County with nearby schools including Stefanik Elementary School, Bellamy Middle School, and Chicopee High School.
Ownership History
Date
Name
Owned For
Owner Type
Purchase Details
Closed on
Jan 8, 2015
Sold by
Korepta Marcin
Bought by
29 & 31 Foss Avenue Rt
Current Estimated Value
Purchase Details
Closed on
May 31, 2000
Sold by
Szarek Stella
Bought by
Korepta Marcin
Home Financials for this Owner
Home Financials are based on the most recent Mortgage that was taken out on this home.
Original Mortgage
$76,400
Interest Rate
8.14%
Mortgage Type
Purchase Money Mortgage
Create a Home Valuation Report for This Property
The Home Valuation Report is an in-depth analysis detailing your home's value as well as a comparison with similar homes in the area
Home Values in the Area
Average Home Value in this Area
Purchase History
| Date | Buyer | Sale Price | Title Company |
|---|---|---|---|
| 29 & 31 Foss Avenue Rt | -- | -- | |
| Korepta Marcin | $84,900 | -- |
Source: Public Records
Mortgage History
| Date | Status | Borrower | Loan Amount |
|---|---|---|---|
| Previous Owner | Korepta Marcin | $75,000 | |
| Previous Owner | Korepta Marcin | $76,400 |
Source: Public Records
Tax History Compared to Growth
Tax History
| Year | Tax Paid | Tax Assessment Tax Assessment Total Assessment is a certain percentage of the fair market value that is determined by local assessors to be the total taxable value of land and additions on the property. | Land | Improvement |
|---|---|---|---|---|
| 2025 | $3,972 | $262,000 | $100,800 | $161,200 |
| 2024 | $3,709 | $251,300 | $98,800 | $152,500 |
| 2023 | $3,491 | $230,400 | $89,800 | $140,600 |
| 2022 | $3,344 | $196,800 | $78,100 | $118,700 |
| 2021 | $3,161 | $179,500 | $71,000 | $108,500 |
| 2020 | $3,021 | $173,000 | $71,000 | $102,000 |
| 2019 | $3,012 | $167,700 | $71,000 | $96,700 |
| 2018 | $3,007 | $160,500 | $67,600 | $92,900 |
| 2017 | $2,631 | $152,000 | $67,600 | $84,400 |
| 2016 | $2,521 | $149,100 | $67,600 | $81,500 |
| 2015 | $2,657 | $151,500 | $67,600 | $83,900 |
| 2014 | $2,501 | $151,500 | $67,600 | $83,900 |
Source: Public Records
Map
Nearby Homes
- 71 Florence St
- 66 Wayfield Ave
- 51 Beaumont Ave
- 87 Blanchwood Ave
- 86 Beaumont Ave
- 54 Dayton St
- 212 Poplar St
- 76 Roy St
- 17 Jeanette Dr
- 87 Clarendon Ave
- 219 Clarendon Ave
- 210 Clarendon Ave
- 89 School St
- 14 Chestnut St
- 18 Chestnut St
- 90 Mckinstry Ave Unit 117
- 200 Lambert Terrace Unit 70
- 200 Lambert Terrace Unit 2
- 0 School St
- 80 Brush Hill Ave Unit 28