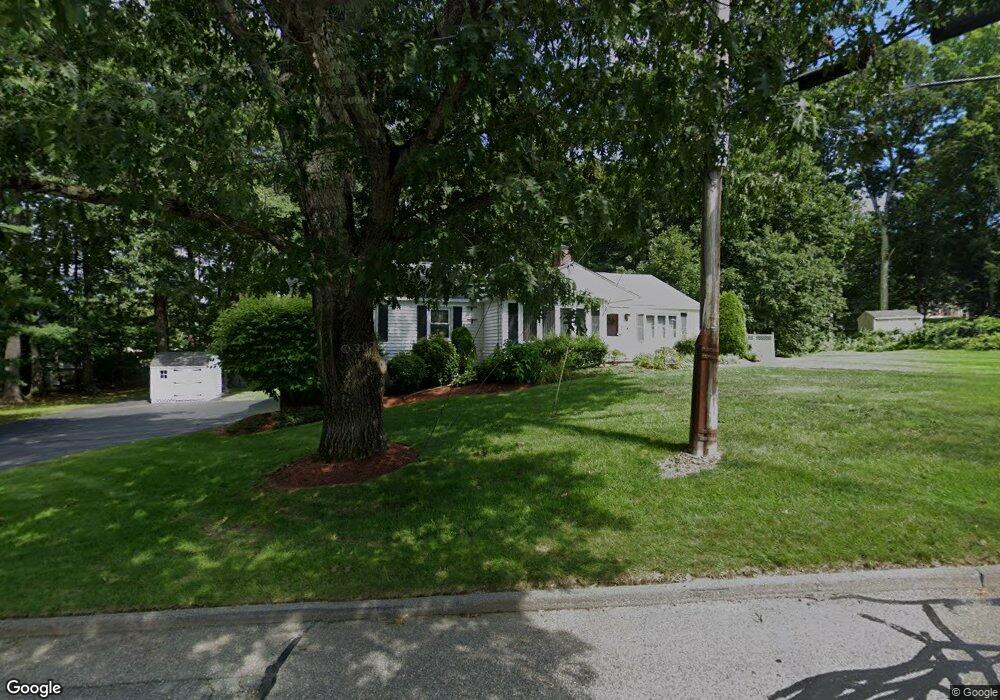
29 Harriman Rd Hudson, MA 01749
Estimated Value: $589,000 - $648,000
3
Beds
2
Baths
1,768
Sq Ft
$355/Sq Ft
Est. Value
About This Home
This home is located at 29 Harriman Rd, Hudson, MA 01749 and is currently estimated at $628,335, approximately $355 per square foot. 29 Harriman Rd is a home located in Middlesex County with nearby schools including David J. Quinn Middle School, Hudson High School, and First Steps Children's Center.
Ownership History
Date
Name
Owned For
Owner Type
Purchase Details
Closed on
Dec 3, 2020
Sold by
Nunes Oliver F
Bought by
Oliver F Nunes Jr Lt
Current Estimated Value
Purchase Details
Closed on
Oct 6, 2020
Sold by
Nunes Eleanor M Est
Bought by
Nunes Oliver F
Create a Home Valuation Report for This Property
The Home Valuation Report is an in-depth analysis detailing your home's value as well as a comparison with similar homes in the area
Home Values in the Area
Average Home Value in this Area
Purchase History
| Date | Buyer | Sale Price | Title Company |
|---|---|---|---|
| Oliver F Nunes Jr Lt | -- | None Available | |
| Oliver F Nunes Jr Lt | -- | None Available | |
| Nunes Oliver F | -- | None Available | |
| Nunes Oliver F | -- | None Available |
Source: Public Records
Tax History Compared to Growth
Tax History
| Year | Tax Paid | Tax Assessment Tax Assessment Total Assessment is a certain percentage of the fair market value that is determined by local assessors to be the total taxable value of land and additions on the property. | Land | Improvement |
|---|---|---|---|---|
| 2025 | $7,615 | $548,600 | $210,700 | $337,900 |
| 2024 | $7,300 | $521,400 | $191,600 | $329,800 |
| 2023 | $6,764 | $463,300 | $184,200 | $279,100 |
| 2022 | $6,821 | $430,100 | $167,400 | $262,700 |
| 2021 | $6,638 | $400,100 | $159,400 | $240,700 |
| 2020 | $6,026 | $362,800 | $156,500 | $206,300 |
| 2019 | $6,030 | $354,100 | $156,500 | $197,600 |
| 2018 | $5,997 | $342,700 | $158,100 | $184,600 |
| 2017 | $5,973 | $341,300 | $156,500 | $184,800 |
| 2016 | $5,574 | $322,400 | $156,500 | $165,900 |
| 2015 | $5,126 | $296,800 | $156,500 | $140,300 |
| 2014 | $5,041 | $289,400 | $137,400 | $152,000 |
Source: Public Records
Map
Nearby Homes
- 107 Washington St
- 243 Washington St
- 56 Park St
- 0 Washington St
- 123 Chapin Rd Unit 1A4
- 196 Chapin Rd
- 168 River Rd E Unit Lot 15A
- 168 River Rd E Unit Lot 5
- 168 River Rd E Unit Lot 3
- 168 River Rd E Unit Lot 11
- 168 River Rd E Unit Lot 2
- 168 River Rd E Unit Lot 6
- 19 Deer Path
- 17 School St Unit C
- 17 School St Unit A
- 243 Gates Pond Rd
- 0 Fitchburg St
- 21 Gates Ave
- 65 Main St
- 16 Houghton St