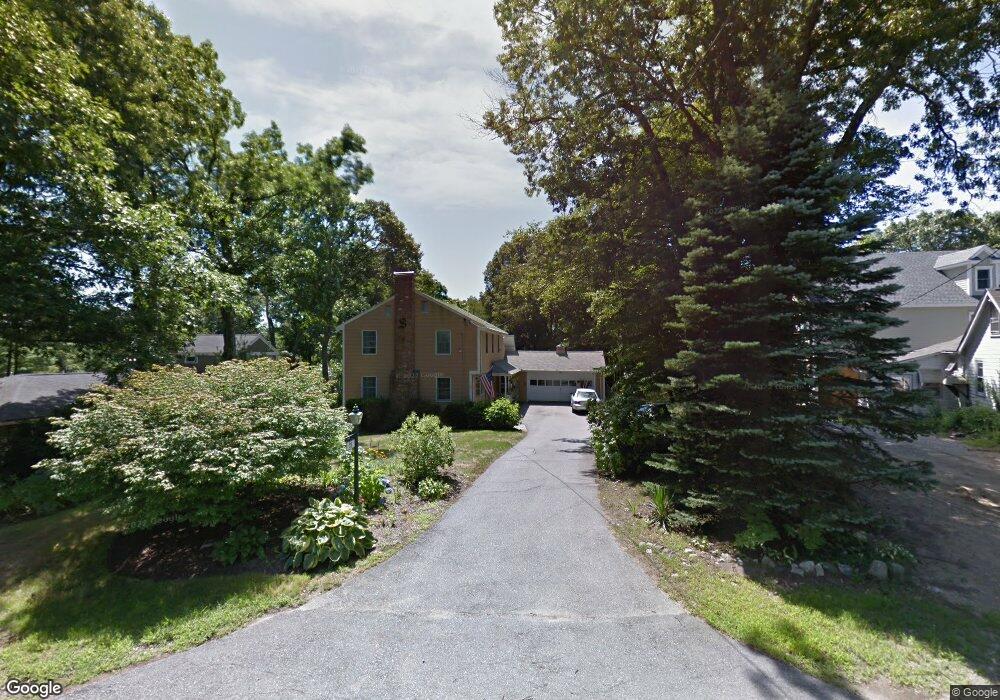
29 James St Lexington, MA 02420
North Lexington NeighborhoodEstimated Value: $1,205,000 - $1,341,000
4
Beds
2
Baths
2,034
Sq Ft
$632/Sq Ft
Est. Value
About This Home
This home is located at 29 James St, Lexington, MA 02420 and is currently estimated at $1,285,030, approximately $631 per square foot. 29 James St is a home located in Middlesex County with nearby schools including Joseph Estabrook Elementary School, William Diamond Middle School, and Lexington High School.
Ownership History
Date
Name
Owned For
Owner Type
Purchase Details
Closed on
Oct 1, 1975
Bought by
Sargent Richard A and Sargent Ruth A
Current Estimated Value
Create a Home Valuation Report for This Property
The Home Valuation Report is an in-depth analysis detailing your home's value as well as a comparison with similar homes in the area
Home Values in the Area
Average Home Value in this Area
Purchase History
| Date | Buyer | Sale Price | Title Company |
|---|---|---|---|
| Sargent Richard A | $8,000 | -- |
Source: Public Records
Mortgage History
| Date | Status | Borrower | Loan Amount |
|---|---|---|---|
| Open | Sargent Richard A | $120,000 | |
| Closed | Sargent Richard A | $150,000 |
Source: Public Records
Tax History Compared to Growth
Tax History
| Year | Tax Paid | Tax Assessment Tax Assessment Total Assessment is a certain percentage of the fair market value that is determined by local assessors to be the total taxable value of land and additions on the property. | Land | Improvement |
|---|---|---|---|---|
| 2025 | $15,104 | $1,235,000 | $741,000 | $494,000 |
| 2024 | $14,639 | $1,195,000 | $706,000 | $489,000 |
| 2023 | $14,560 | $1,120,000 | $642,000 | $478,000 |
| 2022 | $13,745 | $996,000 | $583,000 | $413,000 |
| 2021 | $9,871 | $925,000 | $555,000 | $370,000 |
| 2020 | $9,437 | $917,000 | $555,000 | $362,000 |
| 2019 | $9,130 | $876,000 | $529,000 | $347,000 |
| 2018 | $11,840 | $828,000 | $483,000 | $345,000 |
| 2017 | $3,540 | $730,000 | $470,000 | $260,000 |
| 2016 | $10,322 | $707,000 | $448,000 | $259,000 |
| 2015 | $10,179 | $685,000 | $407,000 | $278,000 |
| 2014 | $9,787 | $631,000 | $386,000 | $245,000 |
Source: Public Records
Map
Nearby Homes
- 18 Heritage Dr
- 83 Winter St
- 6 Hadley Rd
- 45 Shawsheen Rd Unit 28
- 24 Dunelm Rd
- 18 Robinson Rd
- 18 Overlook Dr Unit 2
- 80 Wilson Rd
- 75 Westview St
- 110 Wilson Rd Unit 1
- 101 Burlington St
- 52 Summer St Unit B
- 50 Summer St Unit A
- 225 Middlesex Turnpike Unit 109
- 225 Middlesex Turnpike Unit 105
- 225 Middlesex Turnpike Unit 106
- 39 Neillian St Unit 39
- 125 Burlington St
- 25 Flintlock Rd
- 3a Nowers Rd