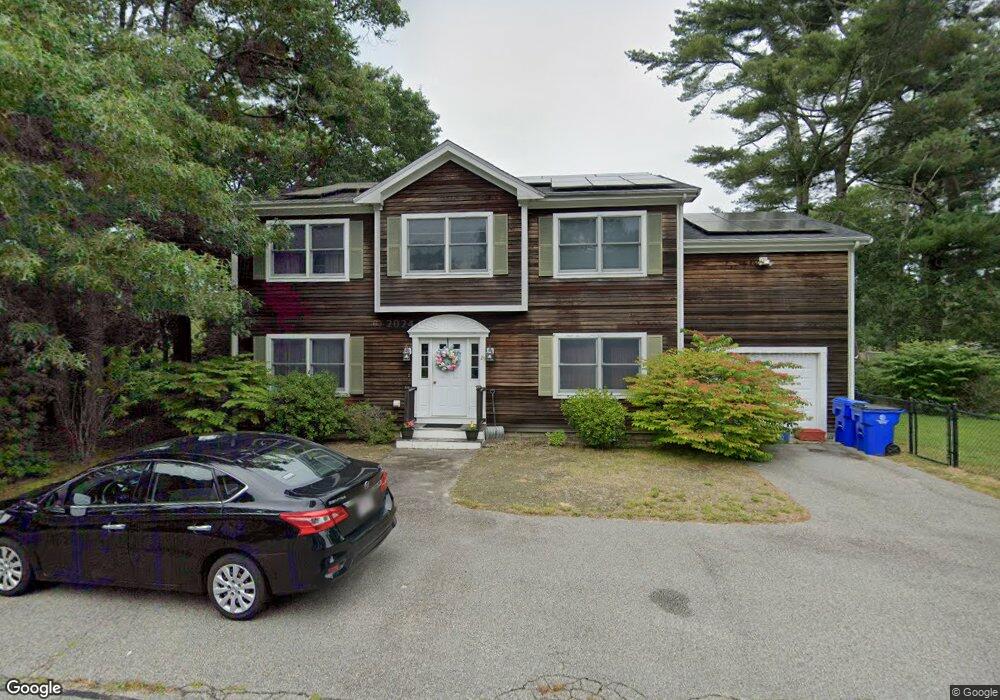
29 Leen Rd Pocasset, MA 02559
Pocasset NeighborhoodEstimated Value: $615,000 - $756,000
2
Beds
1
Bath
650
Sq Ft
$1,024/Sq Ft
Est. Value
About This Home
This home is located at 29 Leen Rd, Pocasset, MA 02559 and is currently estimated at $665,624, approximately $1,024 per square foot. 29 Leen Rd is a home located in Barnstable County with nearby schools including Bourne High School, Cadence Academy Preschool - Bourne, and St Margaret Regional School.
Ownership History
Date
Name
Owned For
Owner Type
Purchase Details
Closed on
Jun 30, 2014
Sold by
Fleck Douglas J
Bought by
Fleck Lisa M
Current Estimated Value
Purchase Details
Closed on
Mar 30, 1995
Sold by
Jackson Leonard C
Bought by
Fleck Douglas J
Home Financials for this Owner
Home Financials are based on the most recent Mortgage that was taken out on this home.
Original Mortgage
$44,000
Interest Rate
8.8%
Mortgage Type
Purchase Money Mortgage
Create a Home Valuation Report for This Property
The Home Valuation Report is an in-depth analysis detailing your home's value as well as a comparison with similar homes in the area
Home Values in the Area
Average Home Value in this Area
Purchase History
| Date | Buyer | Sale Price | Title Company |
|---|---|---|---|
| Fleck Lisa M | -- | -- | |
| Fleck Lisa M | -- | -- | |
| Fleck Douglas J | $55,000 | -- | |
| Fleck Douglas J | $55,000 | -- |
Source: Public Records
Mortgage History
| Date | Status | Borrower | Loan Amount |
|---|---|---|---|
| Previous Owner | Fleck Douglas J | $175,000 | |
| Previous Owner | Fleck Douglas J | $44,000 |
Source: Public Records
Tax History
| Year | Tax Paid | Tax Assessment Tax Assessment Total Assessment is a certain percentage of the fair market value that is determined by local assessors to be the total taxable value of land and additions on the property. | Land | Improvement |
|---|---|---|---|---|
| 2025 | $4,626 | $592,300 | $192,100 | $400,200 |
| 2024 | $4,657 | $580,700 | $199,600 | $381,100 |
| 2023 | $4,561 | $517,700 | $176,700 | $341,000 |
| 2022 | $4,207 | $416,900 | $143,300 | $273,600 |
| 2021 | $4,116 | $382,200 | $130,400 | $251,800 |
| 2020 | $4,003 | $372,700 | $129,200 | $243,500 |
| 2019 | $3,799 | $361,500 | $129,200 | $232,300 |
| 2018 | $3,588 | $340,400 | $128,600 | $211,800 |
| 2017 | $3,496 | $339,400 | $127,400 | $212,000 |
| 2016 | $3,392 | $333,900 | $127,400 | $206,500 |
| 2015 | $2,972 | $295,100 | $88,600 | $206,500 |
Source: Public Records
Map
Nearby Homes
- 7 4th Ave
- 3 4th Ave
- 3 1st St
- 16 Michael Rd
- 709 County Rd
- 254 Barlows Landing Rd
- 48 Red Brook Harbor Rd
- 14 Navajo Rd
- 1234 Route 28a
- 1234 Route 28a
- 566 Shore Rd
- 20 Colony Ave
- 15 Oak Ave
- 75 Winsor Rd
- 31 Baxendale Rd
- 4 Harbor Hill Dr
- 16 Amberwood Ct
- 203 County Rd
- 12 Turnberry Rd Unit 12
- 4 Hollyhock Knoll Ct Unit 4
Your Personal Tour Guide
Ask me questions while you tour the home.